An Overview of VUG vs QQQ
| Vanguard Growth ETF (VUG) | Invesco QQQ (QQQ) | |
|---|---|---|
| Benchmark Index | CRSP US Large Cap Growth Index | Nasdaq-100 Index |
| Management Style | Passive | Passive |
| Inception Date | 26 Jan 2004 | 10 Mar 1999 |
| Expense Ratio | 0.04% | 0.20% |
| Number of Stocks | 260 | 102 |
| % of 10 largest holdings | 48.77% | 51.992% |
| Dividend Yield | 0.67% | 0.69% |
Source: advisors.vanguard.com and www.invesco.com
Vanguard funds are known for their low cost ETFs, as we can see in VUG, the expense ratio is at 0.04% vs QQQ’s 0.20%. For every $10,000 you invest, you are paying $4 and $20 respectively each year in management expenses.
The Dividend Yield for both these ETFs are rather low with VUG at 0.67% and QQQ at 0.69%. This is expected because both these ETFs tracks companies that are of high growth. And growth companies usually retain their a large portion of their earnings for company growth and expansion, instead of distributing it to shareholder as dividend.
Main Difference Between VUG vs QQQ
VUG tracks the CRSP US Large Cap Growth Index. This means it only tracks US companies that are large cap and above that falls under the Growth category.
QQQ tracks the Nasdaq-100 index, which includes 100 of the largest US and International Non financial companies listed on the Nasdaq based on market cap.
VUG has 2.6% of the fund allocated to the Financial sectors, whereas QQQ does not include the financial sector. However, QQQ has 3.49% of the fund allocated to international companies from China, Argentina, Netherlands and Israel, while VUG is a pure US play.
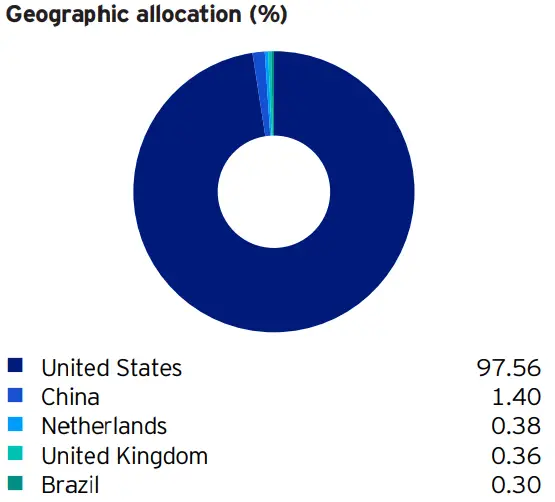
Source: www.invesco.com
Top 10 Holdings
| Vanguard Growth ETF (VUG) | Invesco QQQ (QQQ) |
|---|---|
| Apple Inc. (AAPL) 12.66% | Apple Inc (AAPL) 13.03% |
| Microsoft Corp. (MSFT) 11.56% | Microsoft Corp (MSFT) 10.31% |
| Amazon.com Inc. (AMZN) 5.53% | Amazon.com Inc (AMZN) 6.57% |
| Alphabet Inc. (GOOGL) 3.95% | Tesla Inc (TSLA) 4.05% |
| Tesla Inc. (TSLA) 3.57% | Alphabet Inc (GOOG) 3.78% |
| Alphabet Inc. (GOOG) 3.51% | Alphabet Inc (GOOGL) 3.60% |
| Meta Platforms Inc. (META) 2.23% | Meta Platforms Inc (META) 3.31% |
| NVIDIA Corp. (NVDA) 2.17% | NVIDIA Corp (NVDA) 3.30% |
| Visa Inc. (V) 1.89% | PepsiCo Inc (PEP) 2.03% |
| Home Depot Inc. (HD) 1.70% | Costco Wholesale Corp (COST) 2.03% |
| 48.77% of total asset | 51.992% of total asset |
| as of 22/07/2022 Source: advisors.vanguard.com | as of 22/07/2022 Source: www.invesco.com |
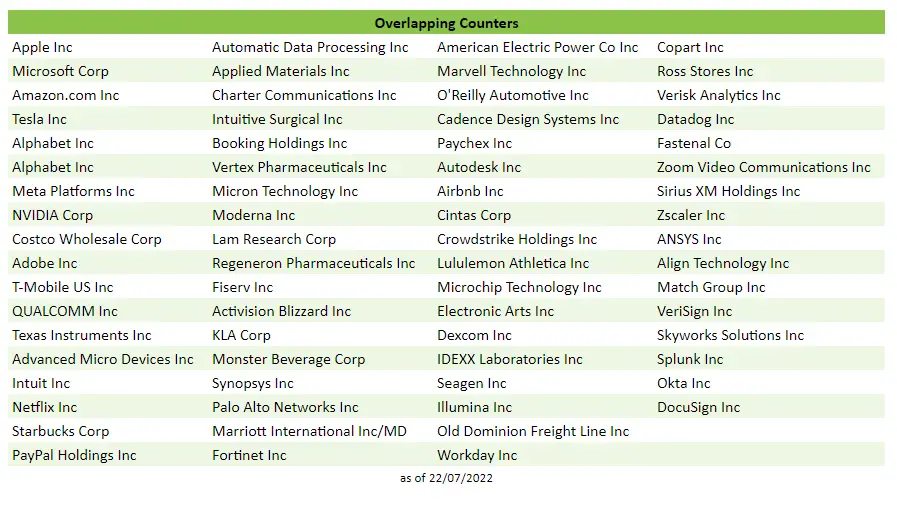
Despite tracking different indexes, these 2 ETFs are more similar than you might think. From the top 10 holdings, 8 of the counters are same. And when we look at all the counters, there are 68 overlapping counters between these 2 funds.
Overlapping Counters
Performance Of VUG vs QQQ
Using the Portfolio Visualizer to back test these 2 ETFs, we can then compare the portfolio growth between Jan 2005 – Jun 2022. The time period was constrained by the available data for Vanguard Growth ETF.
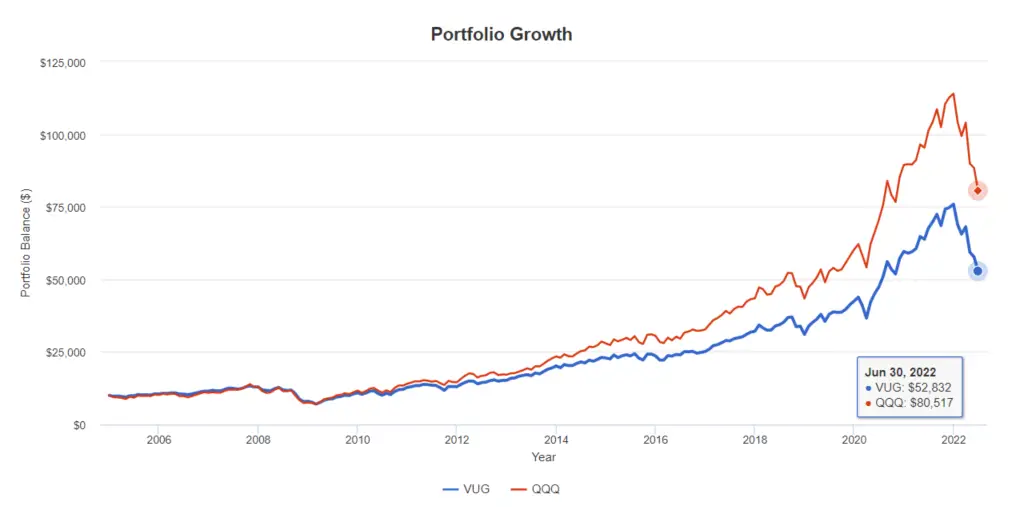
This is what you will end up with at the end of Jun 2022 if you have invest $10,000 in 2005.
VUG (Vanguard Growth ETF): $52,832
QQQ (Invesco QQQ): $80,517
This works out to be 52% more in returns if you had invested in QQQ compared to VUG.
Annual Returns
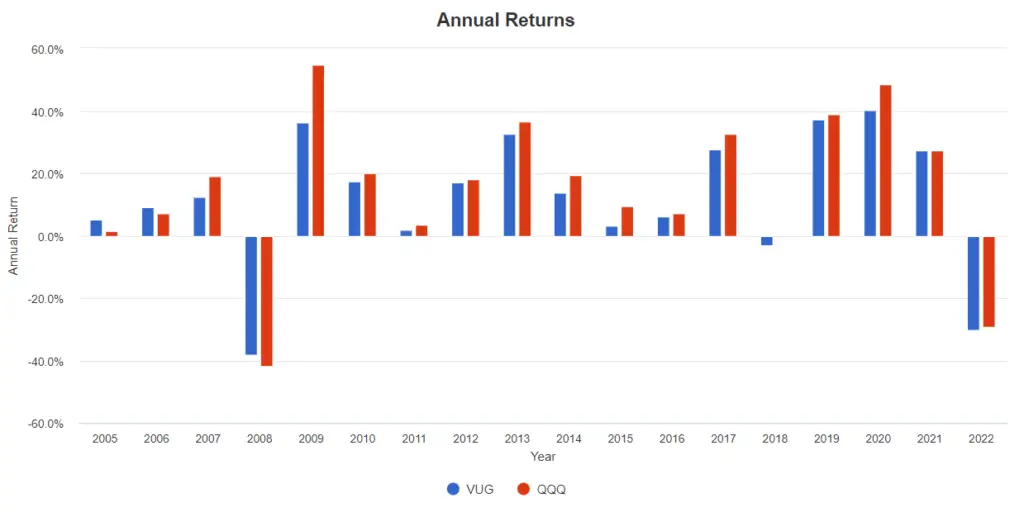
In the period between 2005 to 2022, only in 2008, 2018 and 2022 did both ETFs have negative returns. In 2008, VUG had -38.02% losses vs QQQ’s -41.73%. In 2022, VUG had -30.37% losses vs QQQ’s -29.33%. So it seems during a massive market downturn, both funds perform rather similar, with VUG performing slightly better.
Annualized Returns
| 1 Year | 3 Year | 5 Year | 10 Year | Since Inception | |
|---|---|---|---|---|---|
| VUG | -21.87% | 11.67% | 12.91% | 13.89% | 9.61% |
| QQQ | -20.51% | 15.23% | 16.13% | 17.04% | 8.25% |
Both of these ETFs delivers high annualized returns for a passively managed ETF, with QQQ performing better.
Conclusion
Despite tracking different indexes, we do see that these 2 ETFs has some similarity.
Firstly, 8 of the top 10 counters on both these ETFs are the same. And we see 68 counters that overlaps on both funds.
We can also see the correlation in terms of performance based on the past 17 years. We see the same years that both funds has negative returns and positive returns. Even in a big market down turn like the one in 2008, both ETFs has similar losses.
This is where I think QQQ might be a better choice, if we are basing it purely on returns. Because with similar losses on a downturn, the positive gains however are quite different, as we can see in the portfolio growth.
By investing in QQQ, you would have gain 52% more in returns compared to if you are invested in VUG. Even though QQQ has a higher expense ratio, the returns you’ve gained, would have made up for the higher expenses incurred.
As always, remember that Past Performance is No Guarantee of Future Results.