An Overview Of ICLN vs QCLN
| ICLN | QCLN | |
|---|---|---|
| Benchmark Index | S&P Global Clean Energy Index | NASDAQ Clean Edge Green Energy Index |
| Management Style | Passive | Passive |
| Inception Date | 24 Jun 2008 | 08 Feb 2007 |
| Expense Ratio | 0.46% | 0.60% |
| Number of Stocks | 30 | 44 |
| % of 10 largest holdings | 50.05% | 55.14% |
| AUM | $4.688 B | $3.06 B |
Source: www.ishares.com and www.ftportfolios.com
Differences
ICLN (iShares Global Clean Energy ETF) tracks the S&P Global Clean Energy Index. This index tracks global businesses that comprises of clean energy production, clean energy equipment and technology companies.
QCLN (First Trust NASDAQ Clean Edge Green Energy Index Fund) on the other hand, includes only companies that are publicly traded in the US. They tracks companies that are manufacturers, developers, distributors, and/or installers of clean-energy technologies
The expense ratio is 0.46% for ICLN and 0.60% for QCLN. This means that for every $10,000 invested, $46 (ICLN) and $60 (QCLN) of fees are paid each year for management expenses.
As this is a narrowly focused theme, the number of stock in each of these ETFs is less than 50, with ICLN at 30 vs QCLN at 44 counters.
Top 10 Holdings
| ICLN | QCLN |
|---|---|
| PLUG POWER INC (9.16%) | TESLA, INC. (8.30%) |
| ENPHASE ENERGY INC (5.35%) | ENPHASE ENERGY, INC. (6.85%) |
| XINYI SOLAR HOLDINGS LTD (4.91%) | PLUG POWER INC. (6.72%) |
| VERBUND AG (4.81%) | NIO INC. (ADR) (6.61%) |
| DAQO NEW ENERGY ADR REPRESENTING (4.79%) | ALBEMARLE CORPORATION (5.38%) |
| ORMAT TECH INC (4.58%) | SOLAREDGE TECHNOLOGIES, INC. (4.78%) |
| SIEMENS GAMESA RENEWABLE ENERGY SA (4.57%) | ON SEMICONDUCTOR CORPORATION (4.64%) |
| MERIDIAN ENERGY LTD (4.09%) | CREE, INC. (4.27%) |
| VESTAS WIND SYSTEMS (3.98%) | BROOKFIELD RENEWABLE PARTNERS LP (3.45%) |
| EDP RENOVAVEIS SA (3.81%) | SUNRUN INC. (3.26%) |
| 50.05% of total asset | 54.26% of total asset |
Source: www.ishares.com and www.ftportfolios.com
The top 10 on both ETFs makes up 50% or more of the total asset. This is expected as the number of stocks in both funds are rather small. In addition to that, both are tracking a narrowly focused theme.
What’s interesting here, is that on ICLN, it contains quite a number of utilities companies such as VERBUND AG and MERIDIAN ENERGY LTD, which are both hydro powered electricity providers.
QCLN on the other hand, has TESLA and NIO in their top 10, that’s 15%~ of the fund on Electric Vechicles (EV).
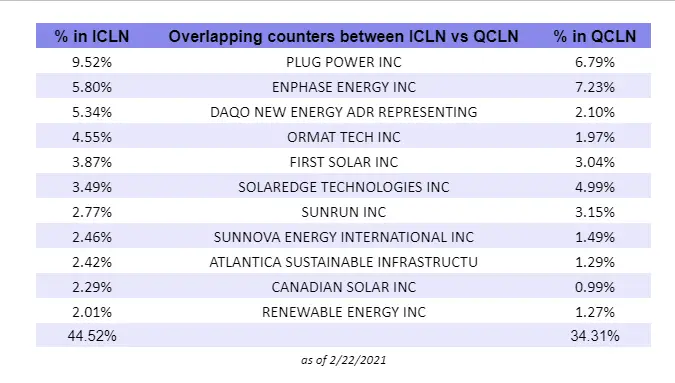
Despite these, there are actually 11 overlapping counters between these 2 funds. And these 11 counters makes up 44.52% in ICLN and 34.31% in QCLN. So essentially, you could be buying 1/3 of ICLN when you buy QCLN.
Performance of ICLN VS QCLN
Using the Portfolio Visualizer to back test these 2 ETFs, we can then compare the portfolio growth between Jul 2008 – Jan 2021. The time period was constrained by the available data for iShares Global Clean Energy ETF (ICLN).
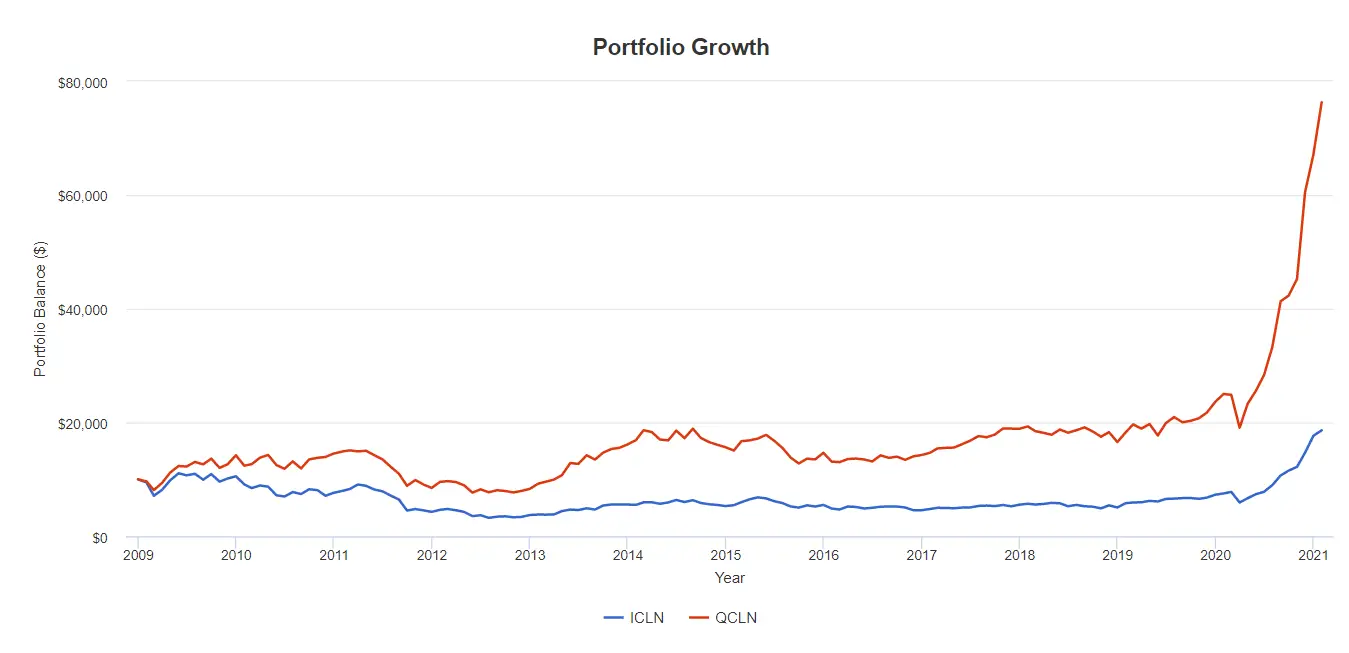
I had to double check my data to make sure it is correct. Look at the huge difference in portfolio growth despite the funds being in the similar clean energy theme.
This is what you will end up with at the end of Jan 2021 if you have invest $10,000 in 2008.
ICLN (iShares Global Clean Energy ETF): $18,625
QCLN (First Trust NASDAQ Clean Edge Green Energy Index Fund): $76,287
This works out to be 309% more in returns if you had invested in QCLN compared to ICLN.
Annualized Returns
| 1 Year | 3 Year | 5 Year | 10 Year | Since Inception | |
|---|---|---|---|---|---|
| ICLN | 147.22% | 48.38% | 31.03% | 8.89% | -2.03% |
| QCLN | 204.46% | 58.13% | 42.07% | 17.74% | 11.01% |
Source: www.ishares.com and www.ftportfolios.com
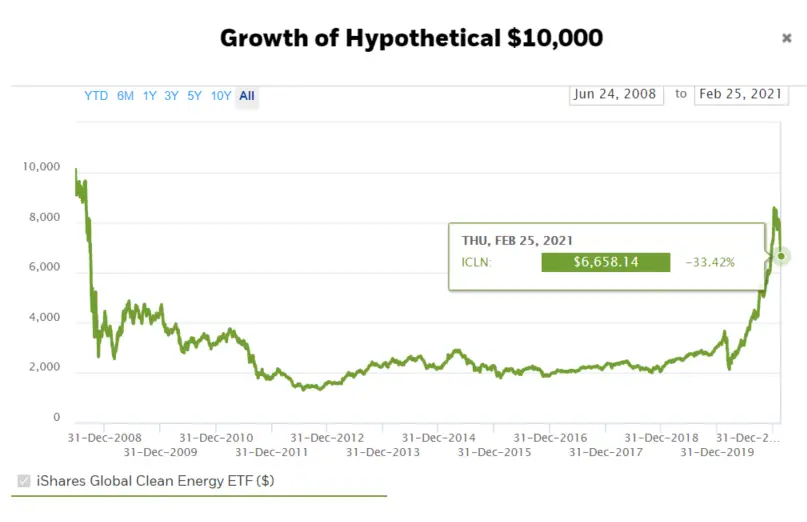
Here’s a interesting fact. If you had invested in ICLN since inception date, you will still be sitting at a loss of -33.42% (as of 2/25/2021).
Conclusion
Both ICLN and QCLN are thematic ETFs that focus on green energy companies. However, despite similar theme, we saw a huge difference in the performance of the funds.
ICLN is more focused on companies that produce energy from solar, wind, and other renewable sources, which is why we don’t see companies like Tesla being included in it.
QCLN has a more diverse list of companies in their portfolio where also they include Energy Storage & Conversion companies. This will see EV companies being included in the list.
Personally, I prefer QCLN, just because it has a more diverse list in the green energy theme. And by buying QCLN, you are also buy 1/3 of ICLN as seen in the list of overlapping companies between these 2 ETFs.
As always, remember that Past Performance is No Guarantee of Future Results.