Vanguard Growth ETF (VUG) and Vanguard S&P 500 Growth ETF (VOOG) are two popular growth funds offered by Vanguard. The main difference is VUG invests in a broad range of growth stocks, whereas VOOG is focused on large-cap growth stocks as represented by the S&P 500 Growth Index.
AN OVERVIEW OF VUG VS VOOG
| Vanguard Growth ETF (VUG) | S&P 500 Growth ETF (VOOG) | |
|---|---|---|
| Benchmark Index | CRSP US Large Cap Growth Index | S&P 500 Growth Index |
| Management Style | Passive Index | Passive Index |
| Inception Date | 26 Jan 2004 | 07 Sep 2010 |
| Expense Ratio | 0.04% | 0.10% |
| Number of Stocks | 253 | 230 |
| % of 10 largest holdings | 57.77%. | 37.61% |
| AUM | $75.9B | $6.8 B |
| Dividend Yield | 0.77% | 1.38% |
Source: advisors.vanguard.com
Vanguard funds are known for their low cost ETF. So it is no surprise that both these ETFs have some of the lowest expense with the VUG at 0.04% and VOOG at 0.10%. This means that for every $10,000 you invest, you are only paying $4 and $10 respectively each year in management expenses.
Both these ETFs has low dividend yield, with VUG at 0.77%, and VOOG at 1.38%. This is expected because both these ETFs focuses on Growth companies. Growth companies usually retain their a large portion of their earnings for company growth and expansion, instead of distributing it to shareholder as dividend.
The main difference is that VUG tracks the CRSP US Large Cap Growth Index where the median market cap is at $193.2 B , whereas VOOG tracks the S&P 500 Growth Index where the median market cap is at $285.8B.
FUND COMPOSITE VUG vs VOOG
Market Capitalization
| Market Size | Vanguard Growth ETF (VUG) | Vanguard S&P 500 Growth ETF (VOOG) |
|---|---|---|
| Large | 82.3% | 88.2% |
| Medium/Large | 4.5% | 2.9% |
| Medium | 11.6% | 8.5% |
| Medium/Small | 1.6% | 0.4% |
| Small | 0.0% | 0.0% |
Source: advisors.vanguard.com
Top 10 Holdings
| Vanguard Growth ETF (VUG) | S&P 500 Growth ETF (VOOG) |
|---|---|
| Apple Inc. (AAPL) 12.52% | Apple Inc. (AAPL) 11.62% |
| Microsoft Corp. (MSFT) 11.39% | Microsoft Corp. (MSFT) 6.20% |
| Amazon.com Inc. (AMZN) 4.64% | Alphabet Inc. (GOOGL) 3.15% |
| Alphabet Inc. (GOOGL) 3.36% | UnitedHealth Group Inc. (UNH) 2.96% |
| Alphabet Inc. (GOOG) 2.93% | Alphabet Inc. (GOOG) 2.81% |
| NVIDIA Corp. (NVDA) 2.18% | Exxon Mobil Corp. (XOM) 2.72% |
| Tesla Inc. (TSLA) 2.11% | NVIDIA Corp. (NVDA) 2.18% |
| Visa Inc. (V) 2.09% | Amazon.com Inc. (AMZN) 2.05% |
| Home Depot Inc. (HD) 2.05% | Visa Inc. (V) 2.03% |
| Mastercard Inc. (MA) 1.91% | Tesla Inc. (TSLA) 1.98% |
| 57.77% of total asset | 37.61% of total asset |
Source: advisors.vanguard.com
From the table we can also see that majority of top 10 companies are tech companies.
Sectors
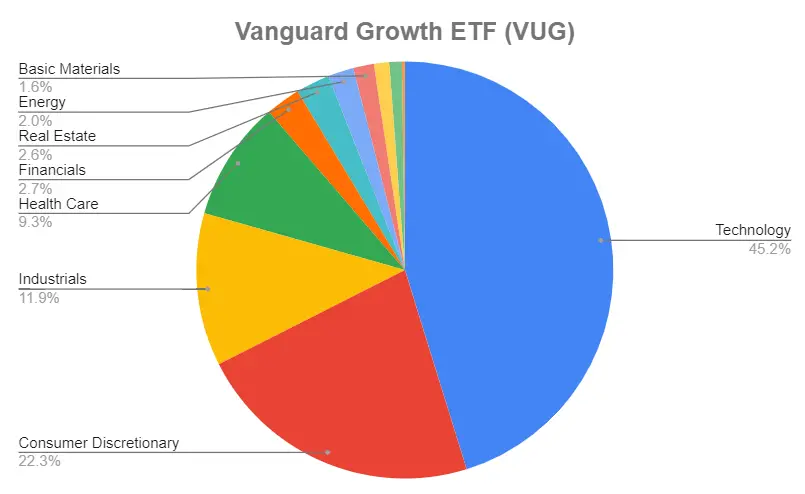
Based on the chart above, we can see that for Technology stocks makes up 45.2% of VUG.
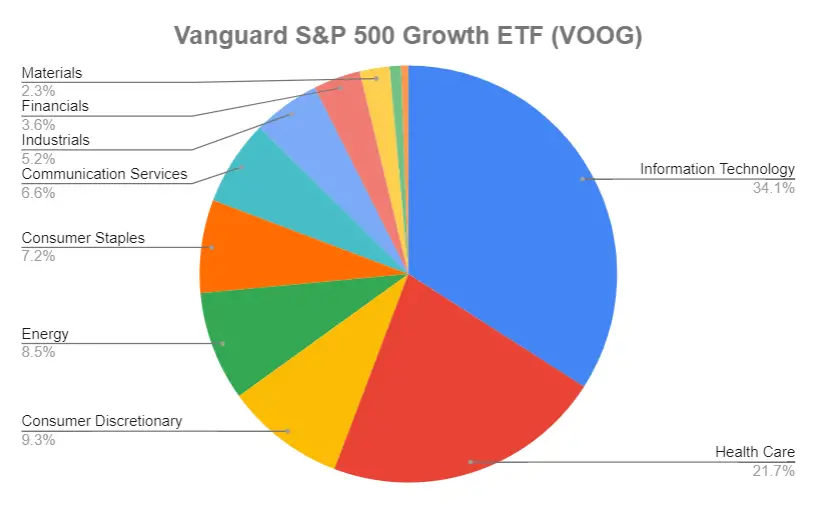
We can see that VOOG is slightly more balanced in terms of exposures in different sectors.
VUG vs VOOG – Performance
Using the Portfolio Visualizer to back test these 2 ETFs, we can then compare the portfolio growth between Jan 2011 – Dec 2022. The time period was constrained by the available data for VOOG (Vanguard S&P 500 Growth ETF).
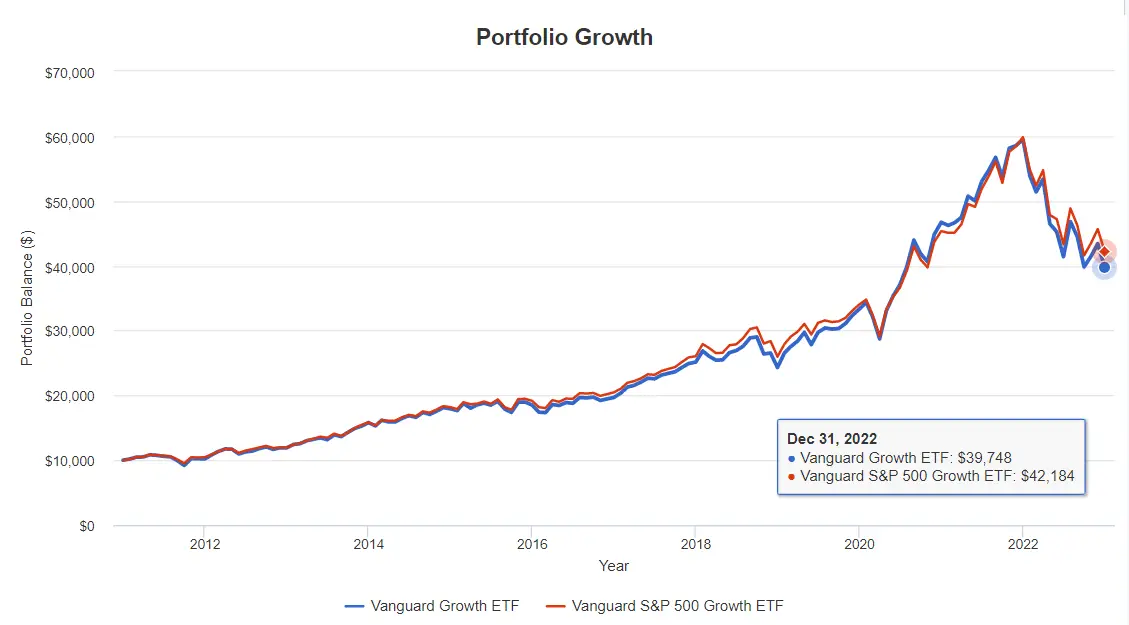
This is what you will end up with at the end of Jan 2022 if you have invest $10,000 in 2011.
VUG (Vanguard Growth ETF): $39,748
VOOG (Vanguard S&P 500 Growth ETF): $42,184
These 2 ETFs has similar growth based on the chart above.
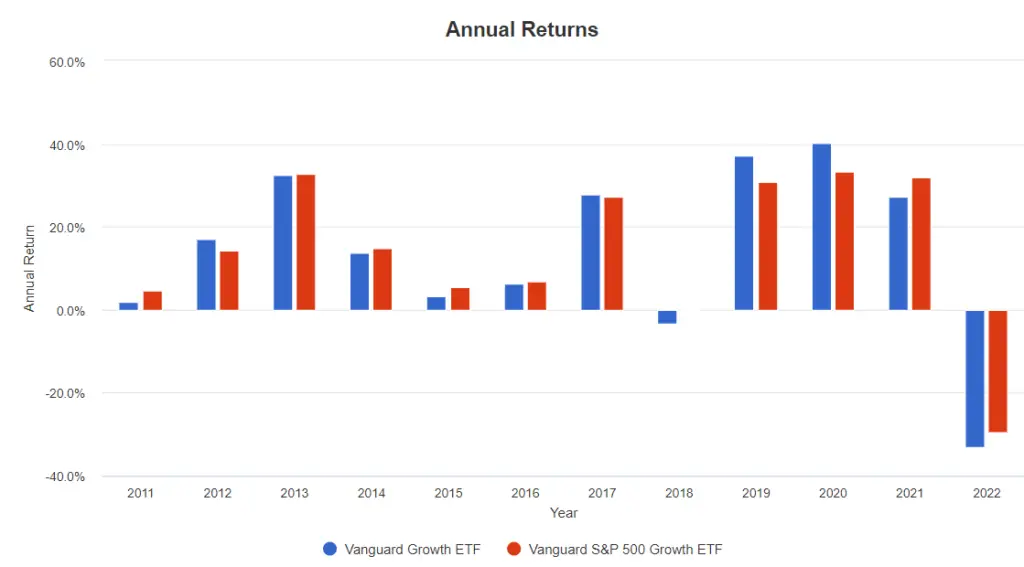
In 2008, VUG had a loss of -3.31% vs VOOG’s -0.22% and in 2022, VUG had a loss of -33.15% vs VOOG’s -29.48%.
Annualized Returns
| 1 Year | 3 Year | 5 Year | 10 year | Since Inception | |
|---|---|---|---|---|---|
| VUG | -33.13% | 6.06% | 9.62% | 12.80% | 9.11% |
| VOOG | -29.48% | 7.44% | 10.14% | 13.44% | 13.86% |
Source: advisors.vanguard.com
VUG VS VOOG – WHICH GROWTH FUND IS BETTER?
Based on past 11 years performance, VOOG performs slightly better than VUG.
In 2022, we saw a big sell off in a lot of Tech companies. Because VUG has almost half of its holdings in Technology sector compared to VOOG’s 34.1%, this was probably part of the reason why VOOG performed slightly better.
If you want a more balanced Growth portfolio, VOOG might be more suitable compared to VUG.
Personally, I still prefer VUG because of the allocation to tech, and it has a lower expense ratio.
My view is to keep investing, especially now when there is a sell off. Inflation rate is at 7%, I just don’t see how holding onto cash is going to work.
As always, remember that Past Performance is No Guarantee of Future Results. And none of the content that I write on this site should be taken as financial advice.