In my existing income portfolio, I have invested in Singapore banks, Real Estate Investment Trusts (REITs) and Singapore Saving Bonds which have provided a steady income stream over time.
The idea of diversifying further into dividend-paying stocks from the US market through dividend ETFs seemed like a logical step to explore next. Recently, the Schwab U.S. Dividend Equity ETF, known as SCHD, has piqued my interest.
In this review, I’ll delve into the fundamentals of SCHD.
Understanding the Index
SCHD tracks the Dow Jones U.S. Dividend 100™ Index. Here’s what you should know about this index.
- What’s Included:
- The index picks stocks from a bigger pool called the Dow Jones U.S. Broad Stock Market Index but leaves out real estate-focused stocks (REITs).
- How Stocks Are Chosen:
- Stocks need to have paid dividends consistently for at least 10 years.
- They should have a market value of at least US$ 500 million.
- They should have a decent amount of buying and selling activity, with at least US$ 2 million traded on average every day over three months.
- Ranking Stocks:
- Once stocks pass the above screens, they are ranked based on the yearly dividend amount they pay compared to their price.
- Picking Stocks for the Index:
- The stocks are further analyzed based on four factors: how well they manage debt, how profitable they are, their dividend yield, and how much their dividend has grown over five years.
- A score is calculated for each stock based on these factors.
- The top 100 stocks with the best scores are picked for the index.
- Keeping the Index Balanced:
- During an annual review, current stocks in the index get a bit of a preference to stay as long as they rank within the top 200.
- If any new stocks are to be added, they’re chosen based on their scores until the index has 100 stocks.
- If two new stocks have the same score, the one that pays a higher dividend gets the spot.
- Weighting Stocks:
- The stocks in the index are reviewed quarterly to ensure no single stock or sector has too much influence on the index’s overall performance.
- No single stock can make up more than 4% of the index, and no single sector can make up more than 25%.
- Daily Checks:
- Every day, a check is done to ensure the weights of the stocks remain balanced. If things go off-balance, adjustments are made to bring it back in line, but these changes take a couple of days to take effect.
[source: https://www.spglobal.com/spdji/en/methodology/article/dow-jones-dividend-indices-methodology/]
Fundamentals of SCHD ETF
Asset Allocation
SCHD tracks the total return of the Dow Jones U.S. Dividend 100™ Index, signifying that investments in this ETF are purely in US equity assets.
Top 10 Holdings
The top holdings in SCHD ETF as of October 26, 2023, are as follows:
| ABBVIE INC | 4.25% |
| VERIZON COMMUNICATIONS INC | 4.20% |
| BROADCOM INC | 4.15% |
| MERCK & CO INC | 4.15% |
| COCA-COLA | 4.07% |
| CHEVRON CORP | 3.99% |
| PEPSICO INC | 3.96% |
| CISCO SYSTEMS INC | 3.91% |
| PFIZER INC | 3.81% |
| Total | 41.15% |
The top holdings represent a variety of sectors including Healthcare (Amgen Inc., AbbVie Inc., Merck & Co Inc., and Pfizer Inc.), Communication Services (Verizon Communications Inc.), Information Technology (Broadcom Inc., Cisco Systems Inc.), Consumer Staples (Coca-Cola, PepsiCo Inc.), and Energy (Chevron Corp.).
This sectoral diversity within the top holdings can contribute to risk mitigation, potentially providing a balanced exposure across different segments of the economy.
Sector allocation
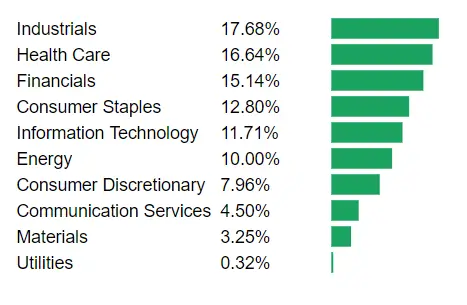
Based on the above, we can see that SCHD showcases a well-diversified sector allocation, with no single sector significantly dominating the asset distribution.
This diversification spans a variety of sectors, potentially aiding in risk reduction and enhancement of returns. The blend of both cyclical and non-cyclical sectors within the ETF might also contribute to maintaining a balanced portfolio adaptable to varying market conditions.
Performance
Historical performance
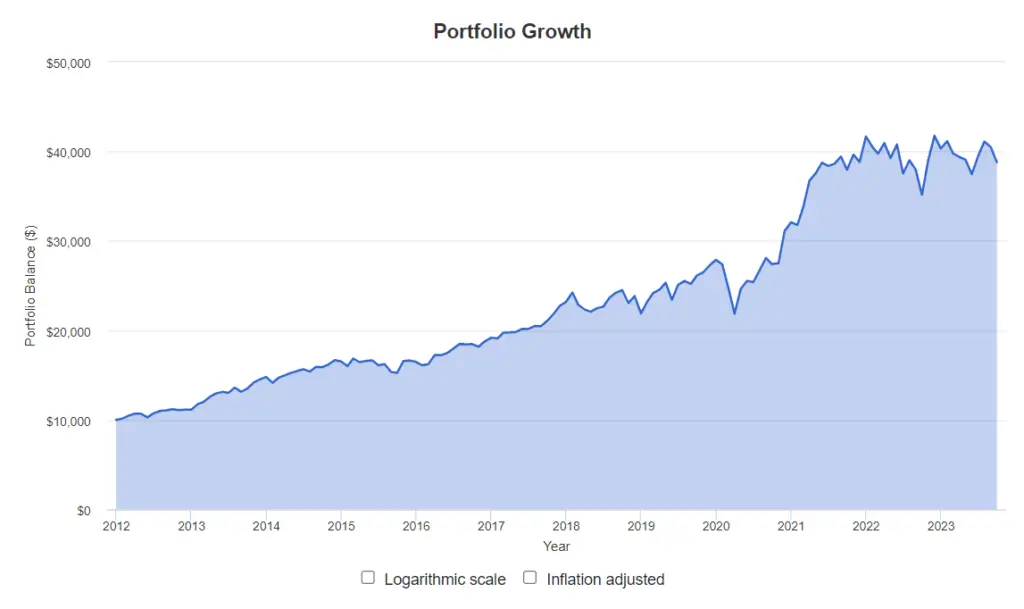
If you had invested $10,000 in SCHD since 2012, your portfolio would have grown to $38,785 at the end of Sep 2023.
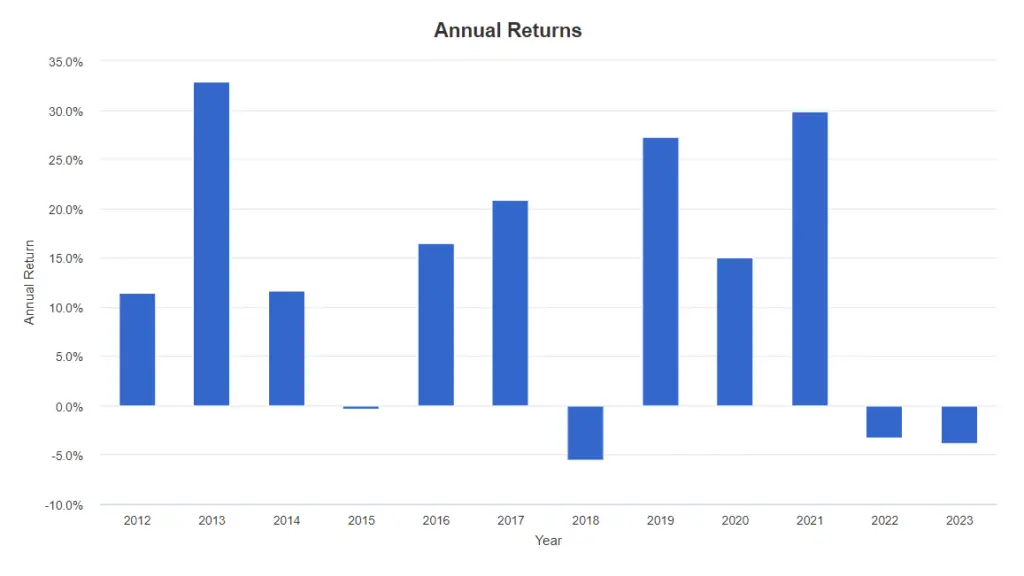
The graph below illustrates the annual returns of SCHD. The fund has navigated through diverse market conditions over the years. Its most challenging year was 2018, during which it experienced a return of -5.56%
Dividend Yield
The SCHD ETF has a dividend yield of 3.70%(TTM) as of 30 Sep 2023. Dividends are disbursed every three months.
Dividend Growth
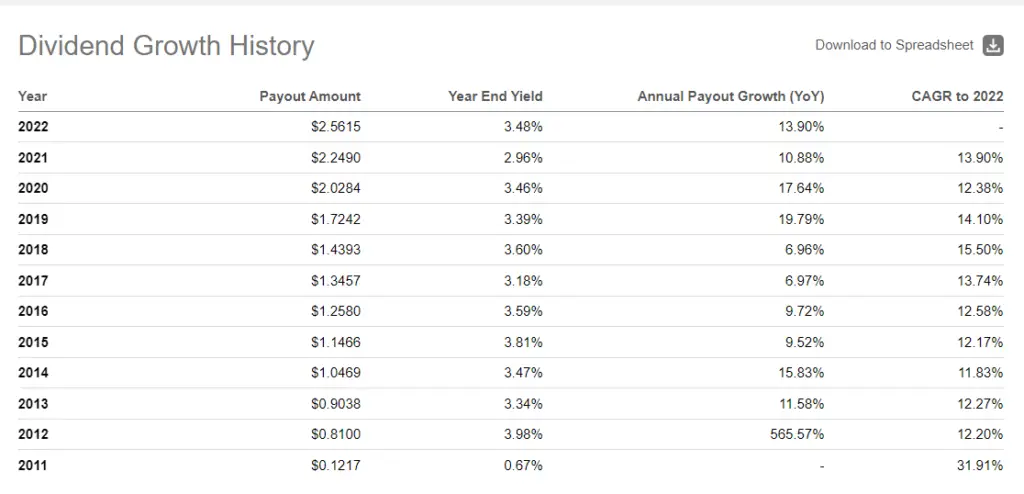
Based on the dividend history, we can see that there is a clear trend of increasing dividend payouts each year from 2011 to 2022. Here are some key observations.
- Consistent Increase in Payout Amount: There has been a consistent upward trend in the payout amount from 2011 ($0.1217) to 2022 ($2.5615). This indicates a strong and steady growth in the income generated by the investment over this period.
- Stable Growth in Subsequent Years: After the notable spike in 2012, the annual payout growth rates from 2013 to 2022 have been relatively stable, ranging from 6.96% to 19.79%. This indicates a period of sustained and consistent growth.
- Overall Upward Trend: The general trend in both payout amounts and growth rates suggests a healthy and growing investment. There’s a clear indication of the investment’s ability to increase its payouts consistently over time.
- Impressive Long-term Performance: Considering the entire period from 2011 to 2022, the investment has shown an impressive ability to increase its payouts, indicating strong overall performance and potentially sound management strategies.
Expense Ratio
The total expense ratio stands at 0.07%, which is deemed to be on the lower end for an exchange-traded fund (ETF).
If you invest $100,000 with a 0.07% expense ratio, your annual fee would be $70.
Now, let’s say your investment grows to $200,000. With the same 0.07% expense ratio, your annual fee would then be around $140.
So, as your investment grows over the years, the amount you pay in fees also increases because it’s a percentage of your total investment. This is an important factor to consider, as while the percentage stays the same, the actual dollar amount you’re paying will go up as your portfolio increases in value.
Who Should Consider Investing in SCHD?
Given the fundamentals of SCHD, it’s essential to consider who might be the ideal investor for this ETF. Here are some key factors to consider:
- Risk Tolerance:
- SCHD, as an ETF that invests in dividend-paying stocks, may exhibit moderate levels of market volatility.
- Investors should be comfortable with the inherent fluctuations of the stock market.
- It’s particularly suitable for those with a medium to high risk tolerance, who can withstand potential short-term market swings in pursuit of long-term gains.
- Investment Horizon:
- SCHD is likely to be more appropriate for investors with a longer investment horizon.
- Given the historical performance and the nature of dividend-paying stocks, investors who can stay invested for a longer period (typically more than 5 years) may see more significant benefits.
- Income Requirements:
- This ETF is tailored towards investors seeking regular income through dividends.
- It could be an excellent choice for retirees or near-retirees looking for a steady income stream.
- It may also appeal to younger investors who wish to reinvest dividends to harness the power of compounding.
- Diversification Needs:
- Investors looking to diversify their portfolio geographically into the U.S. market would find SCHD attractive.
- The ETF’s diverse sector allocation makes it a good option for those seeking to spread their risk across different industries.
- Expense Sensitivity:
- With a low expense ratio of 0.06%, SCHD is suitable for cost-conscious investors who prioritize minimizing fees.
- Dividend Growth Focus:
- Investors specifically interested in a fund that not only provides dividends but also has a history of growing them would find SCHD aligning with their goals.
- Market Understanding:
- Investors considering SCHD should have a basic understanding of the U.S. stock market and the factors that might influence the performance of dividend-paying stocks.
- Tax Considerations:
- Investors should also consider the tax implications of dividend income and how it fits into their overall tax strategy.
Conclusion
Adding SCHD to your income portfolio appears to be a sound decision, especially if your goal is to diversify geographically, maintain a steady income stream, and potentially enjoy capital growth over the long term. This ETF’s robust dividend history, diversified holdings, and low costs align well with an income-focused investment strategy.
Moreover, with the current price of SCHD at a 52-week low ($66.90 as of 29 Oct 2023), it presents an even more compelling opportunity to consider investing.
However, as a non-U.S. resident, you should be aware of the additional tax implications.
E.g. for me as a Singaporean investor, the dividend withholding tax rate of 30% and the U.S. government’s estate tax, which ranges from 18 to 40% for assets worth more than US$60,000, could significantly impact the net returns from my investment in SCHD.
These tax considerations are crucial and might influence the overall attractiveness of investing in U.S.-based assets like SCHD.
As always, it’s prudent to consider your personal financial situation, risk tolerance, and investment objectives before making any investment decisions.