Before deciding which index ETF to invest in, you can find out more on what an ETF is, or what an Index is, and why invest in ETFs here.
An Overview of VUG vs VOO
| Vanguard Growth ETF (VUG) | Vanguard S&P 500 ETF (VOO) | |
|---|---|---|
| Benchmark Index | CRSP US Large Cap Growth Index | S&P 500 Index |
| Management Style | Passive | Passive |
| Expense Ratio | 0.04% | 0.03% |
| Number of Stocks | 253 | 506 |
| % of 10 largest holdings | 41.36% | 25.86% |
| Dividend Yield | 0.77% | 1.71% |
Source: advisors.vanguard.com
Vanguard funds are known for their low cost ETF. So it is no surprise that both these ETFs have some of the lowest expense with the VUG at 0.04% and VOO at 0.03%. This means that for every $10,000 you invest, you are only paying $4 and $3 respectively each year in management expenses.
The dividend yield for the VOO (1.71%) is higher than that of VUG (0.77%). This is expected because VUG consist of Growth companies. Growth companies usually retain their a large portion of their earnings for company growth and expansion, instead of distributing it to shareholder as dividend.
Main Difference between VUG vs VOO
VUG tracks the CRSP US Large Cap Growth Index. This index is made up of growth stocks of large U.S companies. Because only companies that falls under the growth category are included, we can see that there are lesser number of stocks compared to VOO.
VOO tracks the S&P 500 index. The index is dominated by the stocks of large U.S. companies. This can be a blend of large growth and value companies which is why it accounts for a larger number of stocks.
Top 10 Holdings
| Vanguard Growth ETF (VUG) | Vanguard S&P 500 ETF (VOO) |
|---|---|
| Apple Inc. (AAPL) 12.52% | Apple Inc. (AAPL) 6.02% |
| Microsoft Corp. (MSFT) 11.39% | Microsoft Corp. (MSFT) 5.54% |
| Amazon.com Inc. (AMZN) 4.64% | Amazon.com Inc. (AMZN) 2.31% |
| Alphabet Inc. (GOOGL) 3.36% | Berkshire Hathaway Inc. (BRK.B) 1.73% |
| Alphabet Inc. (GOOG) 2.93% | Alphabet Inc. (GOOGL) 1.63% |
| NVIDIA Corp. (NVDA) 2.18% | UnitedHealth Group Inc. (UNH) 1.54% |
| Tesla Inc. (TSLA) 2.11% | Alphabet Inc. (GOOG) 1.46% |
| Visa Inc. (V) 2.09% | Johnson & Johnson (JNJ) 1.43% |
| Home Depot Inc. (HD) 2.05% | Exxon Mobil Corp. (XOM) 1.41% |
| Mastercard Inc. (MA) 1.91% | JPMorgan Chase & Co. (JPM) 1.22% |
| 41.36% of total net asset | 25.86% of total net assets |
Source: advisors.vanguard.com
Top 10 Holdings in VUG makes up 41.36% of the total asset, which constitutes for half the index. Whereas top 10 in VOO only makes up 25.86% of the total asset. If you want a less concentrated top 10 profile, then VOO is the one to choose.
Sectors
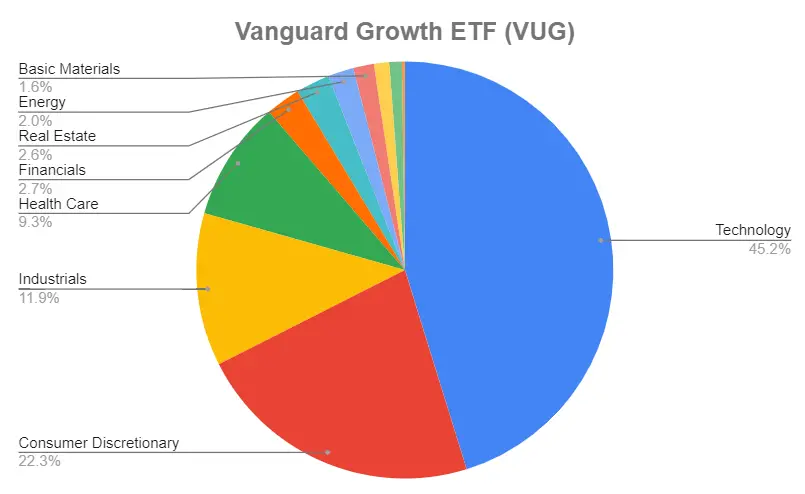
Based on the chart above, we can see that for Technology stocks makes up 45.2% of VUG.
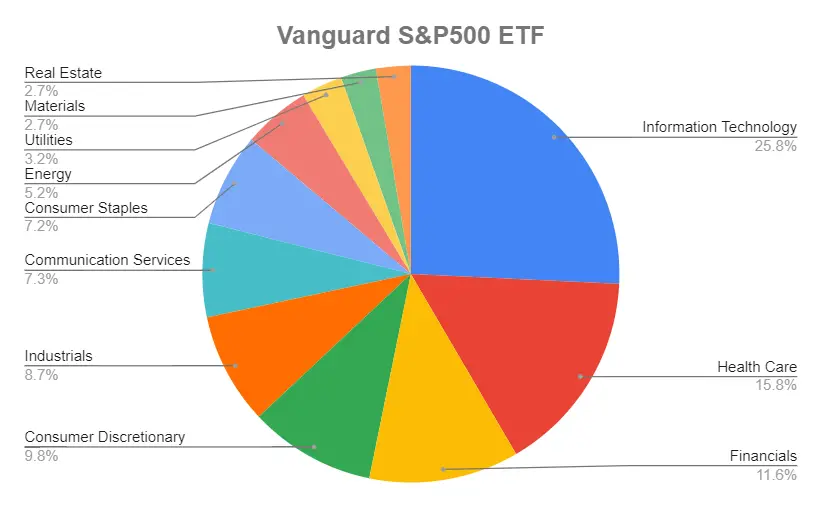
With VOO, you get diversification across the different sectors.
VUG vs VOO – Performance
Using the Portfolio Visualizer to back test these 2 ETFs, we can then compare the portfolio growth between Jan 2011 – Dec 2022. The time period was constrained by the available data for VOO (Vanguard S&P 500 ETF).
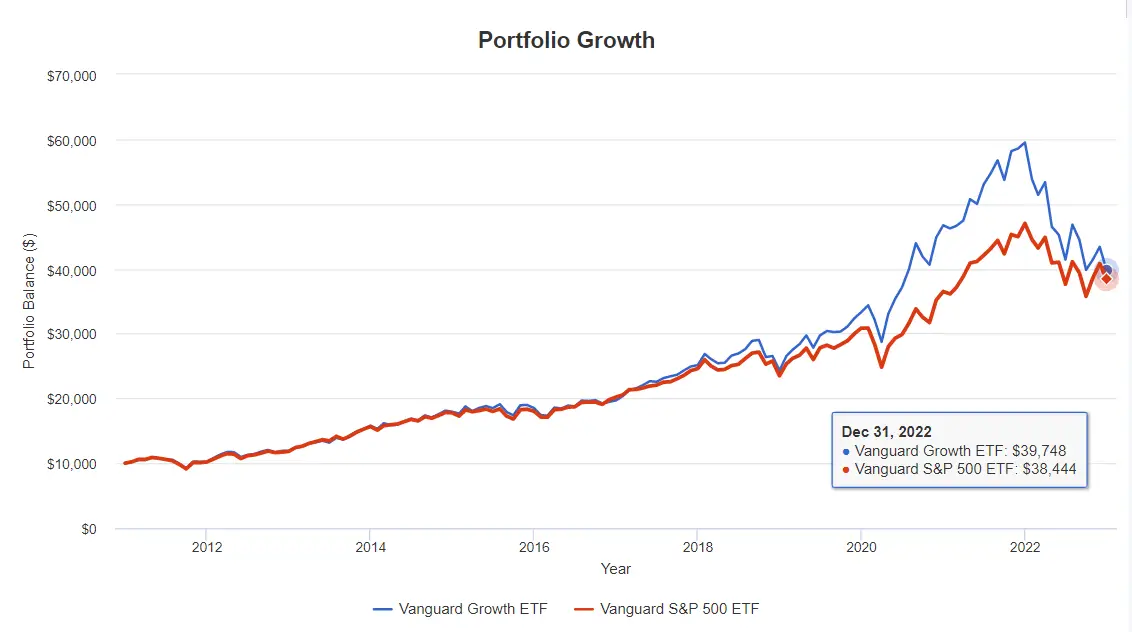
This is what you will end up with at the end of Dec 2022 if you have invest $10,000 in 2011.
VUG (Vanguard Growth ETF): $39,748
VOO (Vanguard S&P 500 ETF): $38,444
Because tech stocks plummeted in 2022, the gains for this 2 ETFs turned out to be rather similar at the end of dec 2022.
As the data is constrained by Vanguard S&P 500 ETF, I ran another back test using Vanguard 500 Index Investor (VFINX), which is the oldest share class of the fund. I wanted to see if the longer time frame would made any difference in the return.
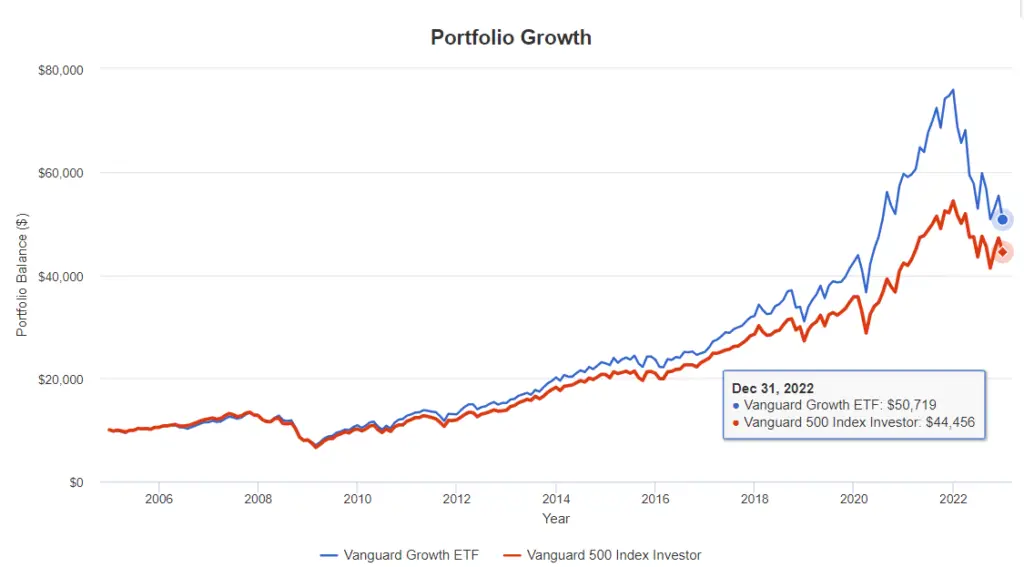
This is what you will end up with at the end of Dec 2022 if you have invest $10,000 in 2005.
VUG (Vanguard Growth ETF): $50,719
VFINX (Vanguard 500 Index Investor): $44,456
In this case we can see that VUG performed slightly better than VFINX by 14%.
Annual Returns
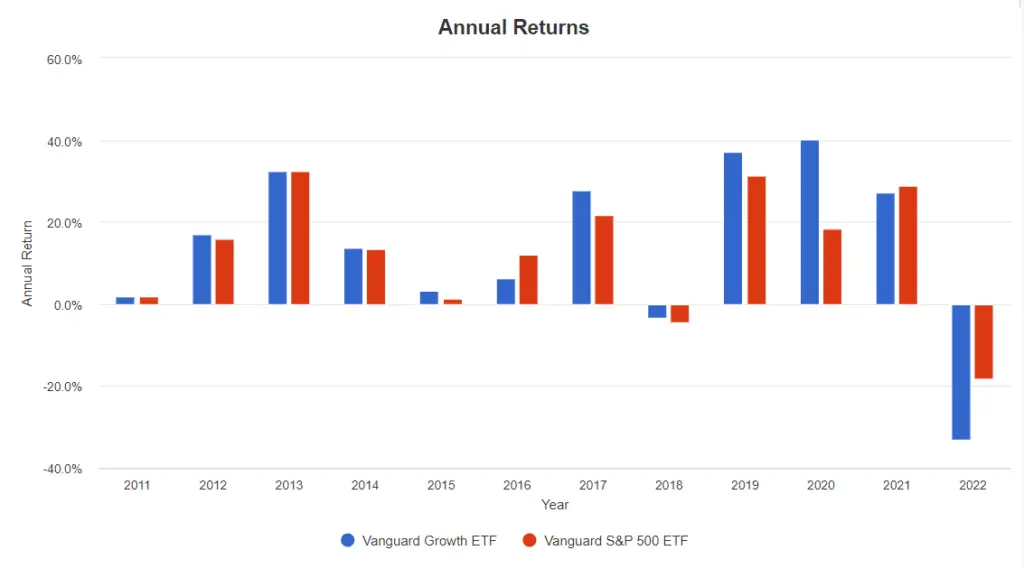
2018 and 2022 were the years that both ETFs return negative returns. VUG delivers a -3.31% vs VOO’s -4.5%. In 2022, we can see that VUG lost -33.15% compare to VOO’s -18.19%.
As we all know, tech stocks plummeted in 2022, and VUG had 45.2% of its holdings in tech stocks. This is why VUG performed more poorly when compared to VOO in 2022.
Annualized Returns
| 1 Year | 3 Year | 5 Year | 10 Year | Since Inception | |
|---|---|---|---|---|---|
| VUG | -33.13% | 6.06% | 9.62% | 12.80% | 9.11% |
| VOO | -18.15% | 7.61% | 9.37% | 12.52% | 12.92% |
Source: advisors.vanguard.com
The 10 years annualized return for VUG vs VOO are 12.80% and 12.52% respectively. These are rather decent returns for funds that are passively managed.
Summary
Based on past performance, it seems that at the end of 2022, both fund performed rather similar because of the massive tech sell off.
As we saw earlier, the Top 10 holdings in VUG makes up almost half the fund. Should anything happen to those holdings, they will greatly impact the returns on VUG. And almost half of its holdings are in the Technology sector.
So for a more diversified portfolio, VOO might be a better choice here. A 12.52% 10 years annualized return is a great feat too.
As always, remember that Past Performance is No Guarantee of Future Results. And none of the content that I write on this site should be taken as financial advice.