An Overview of MGK vs VUG
| Vanguard Mega Cap Growth ETF (MGK) | Vanguard Growth ETF (VUG) | |
|---|---|---|
| Benchmark Index | CRSP US Mega Cap Growth Index | CRSP US Large Cap Growth Index |
| Fund Type | Passive ETF | Passive ETF |
| Expense Ratio | 0.07% | 0.04% |
| Number of Stocks | 96 | 253 |
| % of 10 largest holdings | 49.30% | 57.77%. |
| Dividend Yield | 0.74% | 0.77% |
| AUM | $10.7B | $75.9B |
Source: advisors.vanguard.com
Vanguard funds are known for their low cost ETF. MGK has expense ratio of 0.07% vs VUG’s 0.04%. For every $10,000 you invest, you are only paying $7 and $4 respectively each year in management expenses.
Both these ETFs has similar Dividend Yield. MGK’s 0.57% yield is slightly lower than VUG’s 0.59%. These low yield expected because growth companies usually retain their a large portion of their earnings for company growth and expansion, instead of distributing it to shareholder as dividend.
Another difference we see is the size of the AUM. MGK has a smaller AUM with $10B compared to VUG’s $145.7B. That is like 10x bigger.
Main Difference between MGK vs VUG
| Median Market Cap | |
|---|---|
| MGK | $360.7B |
| VUG | $193.2B |
Source: advisors.vanguard.com
MGK tracks the CRSP US Mega Cap Growth Index. Only growth companies that are of Mega Market Cap are included. This is why we see lesser number of stocks compared to VUG.
VUG on the other hand, tracks the CRSP US Large Cap Growth Index. This means that any growth companies that are Large Market Cap and above will be included, thus the larger number of stocks we see in VUG
Top 10 Holdings
| Vanguard Mega Cap Growth ETF (MGK) | Vanguard Growth ETF (VUG) |
|---|---|
| Apple Inc. (AAPL) 15.15% | Apple Inc. (AAPL) 12.52% |
| Microsoft Corp. (MSFT) 13.79% | Microsoft Corp. (MSFT) 11.39% |
| Amazon.com Inc. (AMZN) 5.62% | Amazon.com Inc. (AMZN) 4.64% |
| Alphabet Inc. (GOOGL) 4.06% | Alphabet Inc. (GOOGL) 3.36% |
| Alphabet Inc. (GOOG) 3.54% | Alphabet Inc. (GOOG) 2.93% |
| NVIDIA Corp. (NVDA) 2.63% | NVIDIA Corp. (NVDA) 2.18% |
| Visa Inc. (V) 2.61% | Tesla Inc. (TSLA) 2.11% |
| Tesla Inc. (TSLA) 2.55% | Visa Inc. (V) 2.09% |
| Home Depot Inc. (HD) 2.48% | Home Depot Inc. (HD) 2.05% |
| Mastercard Inc. (MA) 2.32% | Mastercard Inc. (MA) 1.91% |
| 57.20% of total net asset | 57.77% of total net asset |
Source: advisors.vanguard.com
Top 10 holdings on both ETFs are the same. It is of no surprise. Because these index are Market Cap Weighted. So obviously, the top 10 Market Caps for both will make up the top 10 holdings.
Even the top 10 % of total holding are similar. These are still very high concentration of stocks just from the top 10 holdings.
Sectors
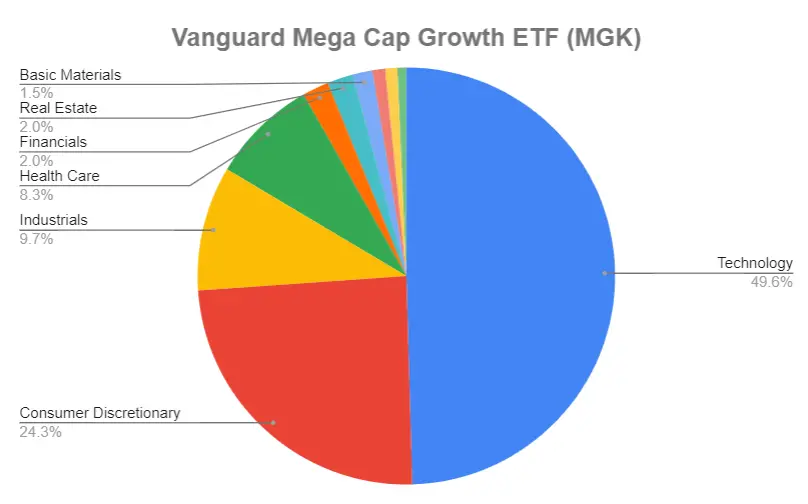
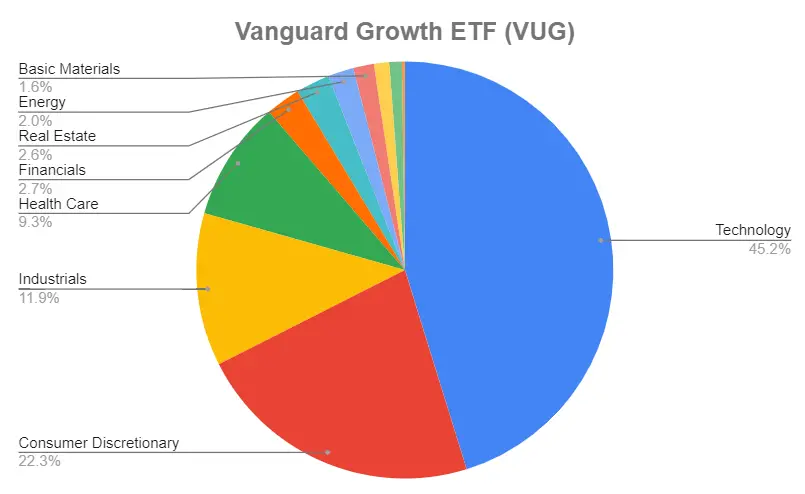
From the charts above, we can see that both ETFs are heavily tilted towards the Technology sector
MGK vs VUG – Performance
Using the Portfolio Visualizer to back test these 2 ETFs, we can then compare the portfolio growth between Jan 2008 – Dec 2022. The time period was constrained by the available data for MGK (Vanguard Mega Cap Growth ETF).
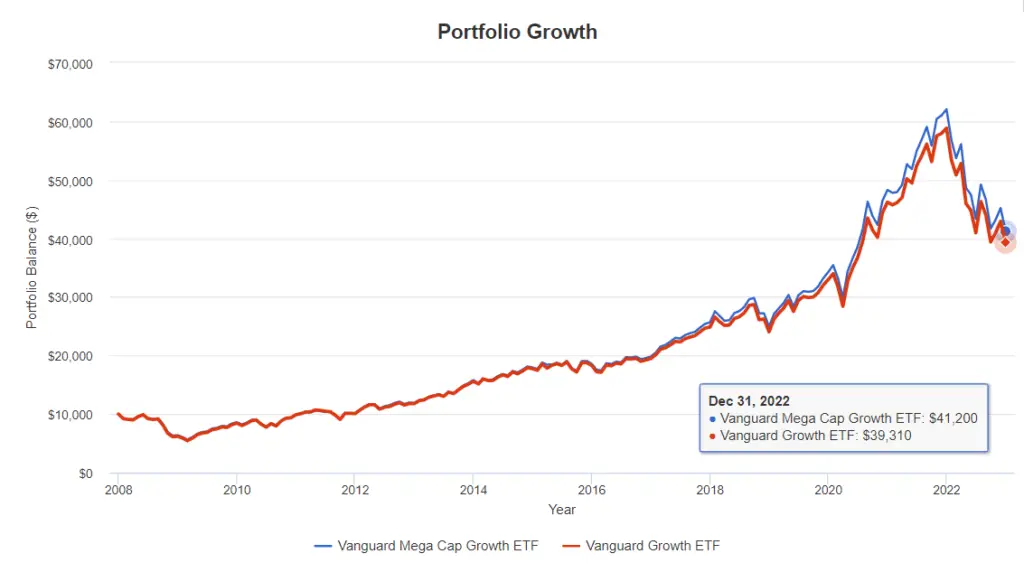
This is what you will end up with at the end of Dec 2022 if you have invest $10,000 in 2008.
MGK (Vanguard Mega Growth ETF): $41,200
VUG (Vanguard Growth ETF): $39,310
This works out to be 4.8% more returns if you have invested in MGK.
Annual Returns
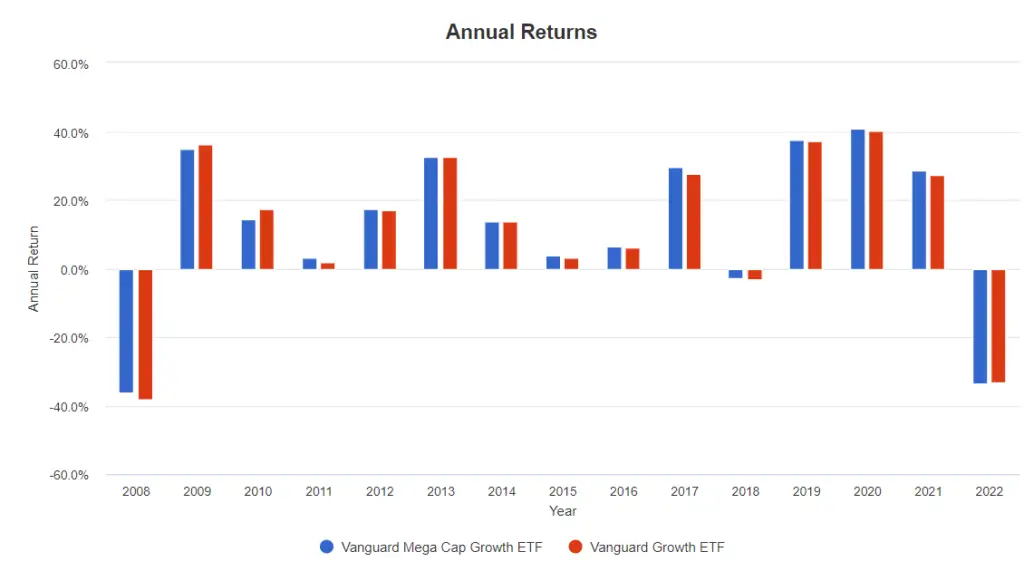
| Years that return Negative returns | MGK | VUG |
|---|---|---|
| 2008 | -36.25% | -38.02% |
| 2018 | -2.90% | -3.31% |
| 2022 | -33.59% | -33.15% |
Both ETF performed rather similar in terms of market downturn. During a mega crisis like the ones in 2008 and 2022, one should be able to stomach more than 30% losses for both ETFs in a year..
Annualized Returns
| 1 Year | 3 Year | 5 Year | 10 Year | Since Inception | |
|---|---|---|---|---|---|
| MGK | -33.56% | 6.38% | 9.95% | 13.21% | 10% |
| VUG | -33.13% | 6.06% | 9.62% | 12.80% | 9.11% |
Source: advisors.vanguard.com
The annualized returns we see for both these funds are very similar, with a difference of approx. 1% difference.
Conclusion – Which Vanguard Growth ETF Should You Choose?
As we can see from the performance chart and the annualized returns table, these 2 ETFs have very similar characteristics and returns. MGK did perform slightly better than VUG based on the past data.
Personally, I am invested in VUG, because it is more diversified with more stocks in the ETF, and it has a larger AUM. Which means it may have more volume than MGK.
So if you want a more diversified portfolio, maybe you can consider VUG. But other than that, they are really similar in terms of returns and drawdowns.
As always remember that Past Performance is No Guarantee of Future Results.