An overview of VTI vs SPTM
| VTI (Total Stock Market) | SPTM (S&P 1500® Composite Stock Market) | |
|---|---|---|
| Benchmark Index | CRSP US Total Market Index | S&P Composite 1500® Index |
| Inception Date | 24 May 2001 | 04 Oct 2000 |
| Expense Ratio | 0.03% | 0.03% |
| Number of Stocks | 4098 | 1521 |
| Yield | 1.59% | 1.55% |
| % of 10 largest holdings | 22.47% | 25.40% |
| AUM | 244.5 B | 5.65 B |
source: advisors.vanguard.com and www.ssga.com
Both funds rocked at having a low expense ratio of 0.03%. This means that for every $10,000 you invest, you are only paying $3 each year in management expenses. And both funds have similar of around 1.5%.
The main difference is that VTI tracks the CRSP US Total Market Index which consist of 4098 stock holdings in the fund, whereas SPTM tracks the S&P Composite 1500® Index which has only 1521 stock holdings. Another stark difference is the AUM. VTI is obviously the larger fund with $244.5B AUM, and SPTM only has $5.65B AUM. Which might mean that VTI will be more liquid than SPTM.
Fund Composite VTI vs SPTM
Top 10 Holdings
| VTI | SPTM |
|---|---|
| Apple Inc. (AAPL) 5.52% | Apple Inc. (AAPL) 6.46% |
| Microsoft Corp. (MSFT) 5.05% | Microsoft Corporation (MSFT) 5.52% |
| Amazon.com Inc. (AMZN) 2.41% | Amazon.com Inc. (AMZN) 2.85% |
| Alphabet Inc. (GOOGL) 1.73% | Tesla Inc (TSLA) 1.88% |
| Tesla Inc. (TSLA) 1.56% | Alphabet Inc. Class A (GOOGL) 1.82% |
| Alphabet Inc. (GOOG) 1.53% | Alphabet Inc. Class C (GOOG) 1.69% |
| UnitedHealth Group Inc. (UNH) 1.27% | Berkshire Hathaway Inc. Class B (BRK.B) 1.42% |
| Johnson & Johnson (JNJ) 1.23% | UnitedHealth Group (Incorporated) UNH 1.36% |
| Berkshire Hathaway Inc. (BRK.B) 1.20% | Johnson & Johnson (JNJ) 1.21% |
| Meta Platforms Inc. (META) 0.97% | NVIDIA Corporation (NVDA) 1.19% |
| 22.47% of total asset | 25.40% of total asset |
source: advisors.vanguard.com and www.ssga.com
The top 10 holdings of VTI makes up 22.47% of the total assets whereas top t10 for SPTM makes up 25.40%. 9 out of the 10 holdings are the same on both ETFs.
What’s interesting too is that there are 1502 overlapping holdings between these funds. This means if you bought VTI, you will also be buying most of SPTM.
VTI vs SPTM – Performance
Using the Portfolio Visualizer to back test these 2 ETFs, we can then compare the portfolio growth between Jan 2002 – July 2022.
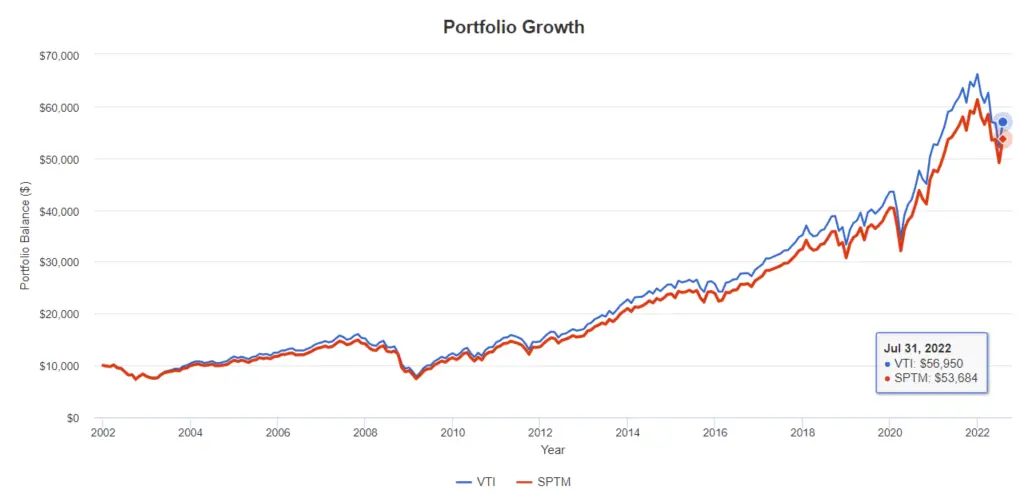
This is what you will end up with at the end of Jul 2022 if you have invest $10,000 in 2002.
VTI: $56,950
SPTM: $53,684
This works out to be 6% more returns if you have invested in VTI compared to investing in SPTM.
Annual Returns
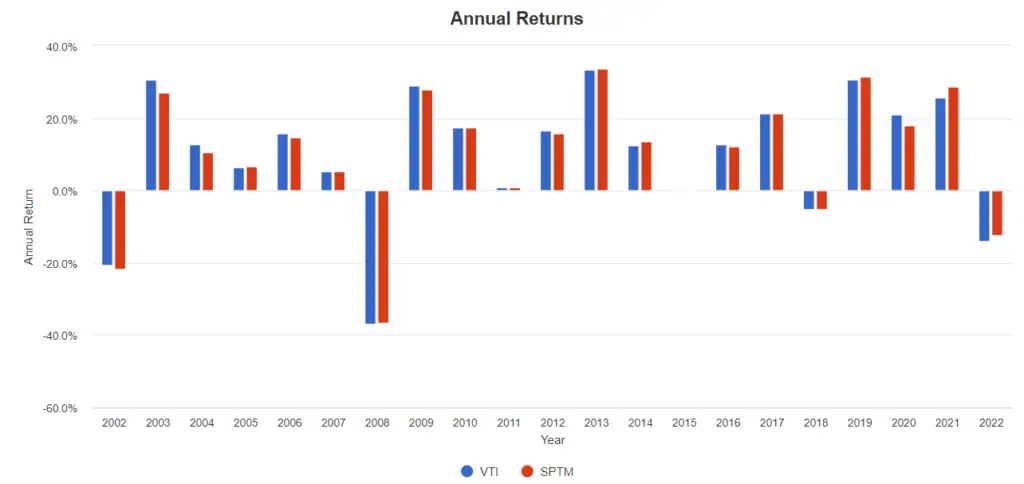
Both these fund performed quite similar during market down turns.
| VTI | SPTM | |
|---|---|---|
| 2002 | -20.47% | -21.59% |
| 2008 | -36.98% | -36.69% |
| 2018 | -5.21% | -5.29% |
| 2022 | -13.97% | -12.39% |
Annualized Returns
| 1 Year | 3 Year | 5 Year | 10 Year | Since Inception | |
|---|---|---|---|---|---|
| VTI | -7.74% | 12.42% | 12.10% | 13.42% | 8.01% |
| SPTM | -10.92% | 10.23% | 10.93% | 12.70% | 6.78% |
source: advisors.vanguard.com and www.ssga.com
The 10 year annualized return for VTI and SPTM are rather similar at 13.42% vs 12.70% respectively. These are rather decent returns for funds that are passively managed.
Conclusion
Based on past performance, VTI seems to deliver a slightly better return.
Both ETFs has similar drawdowns during down turns. Higher returns for a similar risk just makes more sense.
Also, VTI has a much larger AUM than SPTM. It just seem better to invest in a fund that is larger.
As always, remember that Past Performance is No Guarantee of Future Results. And none of the content that I write on this site should be taken as financial advice.