VOO (Vanguard S&P 500 ETF) and VGT (Vanguard Information Technology ETF) are both exchange-traded funds (ETFs) that provide exposure to the US stock market. VOO tracks the performance of the S&P 500 Index whereas VGT, invests in companies in the technology sector.
The main difference between VOO and VGT is the investment objective and the industries they invest in, with VOO providing broad market exposure and VGT focusing on a specific sector.
An Overview of VOO vs VGT
| VOO (Vanguard S&P 500 ETF) | VGT (Vanguard Information Technology ETF) | |
|---|---|---|
| Benchmark Index | S&P 500 Index | MSCI US Investable Market Information Technology 25/50 Index. |
| Style | Passive | Passive |
| Inception Date | 07 Sep 2010 | 26 Jan 2004 |
| Expense Ratio | 0.03% | 0.10% |
| Number of Stocks | 506 | 368 |
| Yield | 1.71% | 1.02% |
| % of 10 largest holdings | 25.86% | 64.54% |
| AUM | $262.2 B | $39.4 B |
Source: advisors.vanguard.com
Vanguard funds are known for their low cost ETF. So it is no surprise that both these ETFs have some of the lowest expense with the VOO at 0.03% and VGT at 0.10%. This means that for every $10,000 you invest, you are only paying $3 and $10 respectively each year in management expenses.
VOO has a dividend yield of 1.71% vs VGT’s 1.02%. If you are buying for dividend too, then this is something to consider.
Fund Composite VOO VS VGT
Top 10 Fund Holdings
| VOO | VGT |
|---|---|
| Apple Inc. (AAPL) 6.02% | Apple Inc. (AAPL) 20.42% |
| Microsoft Corp. (MSFT) 5.54% | Microsoft Corp. (MSFT) 18.12% |
| Amazon.com Inc. (AMZN) 2.31% | NVIDIA Corp. (NVDA) 3.88% |
| Berkshire Hathaway Inc. (BRK.B) 1.73% | Visa Inc. (V) 3.40% |
| Alphabet Inc. (GOOGL) 1.63% | Mastercard Inc. (MA) 3.20% |
| UnitedHealth Group Inc. (UNH) 1.54% | Broadcom Inc. (AVGO) 2.41% |
| Alphabet Inc. (GOOG) 1.46% | Cisco Systems Inc./Delaware (CSCO) 2.11% |
| Johnson & Johnson (JNJ) 1.43% | Accenture plc (ACN) 1.80% |
| Exxon Mobil Corp. (XOM) 1.41% | Adobe Inc. (ADBE) 1.69% |
| JPMorgan Chase & Co. (JPM) 1.22% | Texas Instruments Inc. (TXN) 1.62% |
| 25.86% of total asset | 64.54% of total asset |
Source: advisors.vanguard.com
Top 10 holdings of VOO only makes up a quarter of the total asset compared to more than half of the total asset for VGT. From this we can gather that performance of VGT could hinge a lot on the top 10 holdings.
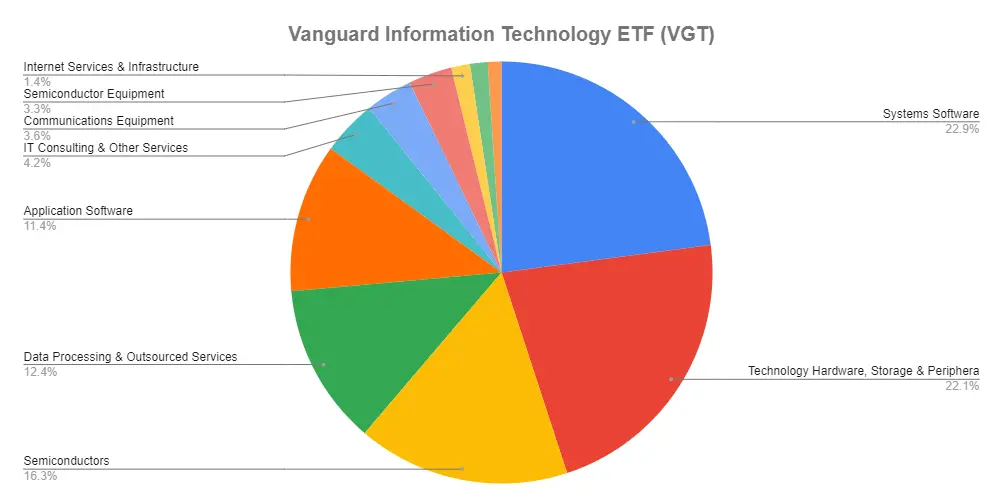
Another thing that I noticed with VGT is that companies such as Amazon, Facebook and Google are not included in the ETF. Amazon is classified as Internet & Direct Marketing Retail and Google and Facebook are under Interactive Media & Services. This means they do not fall under any the sub categories in VGT as seen below.
Sectors
With VOO, you get diversification across the different sectors including Information Technology.
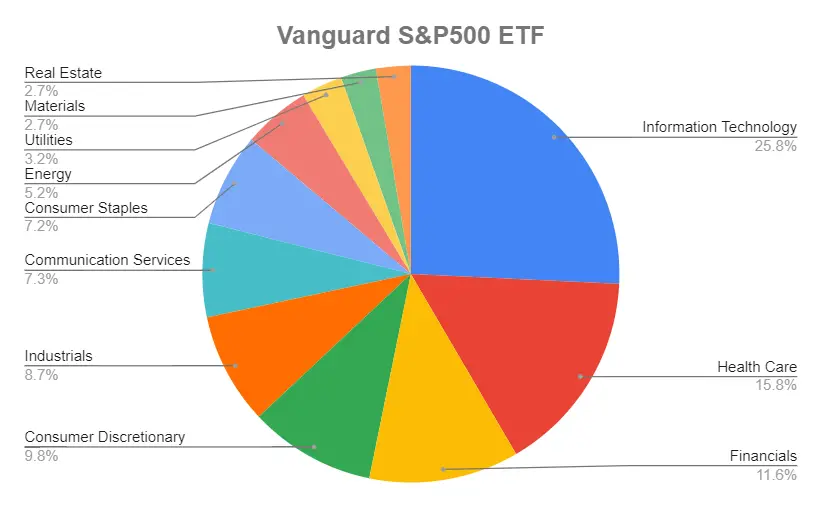
But with VGT, you are investing only on the Information Technology sector. We can see that VGT invests 22.9% of the fund in companies that are under the System Software category.
Performance of VOO vs VGT
Using the Portfolio Visualizer to back test these 2 ETFs, we can then compare the portfolio growth between Jan 2011 – Dec 2022. The time period was constrained by the available data for Vanguard S&P 500 ETF (VOO).
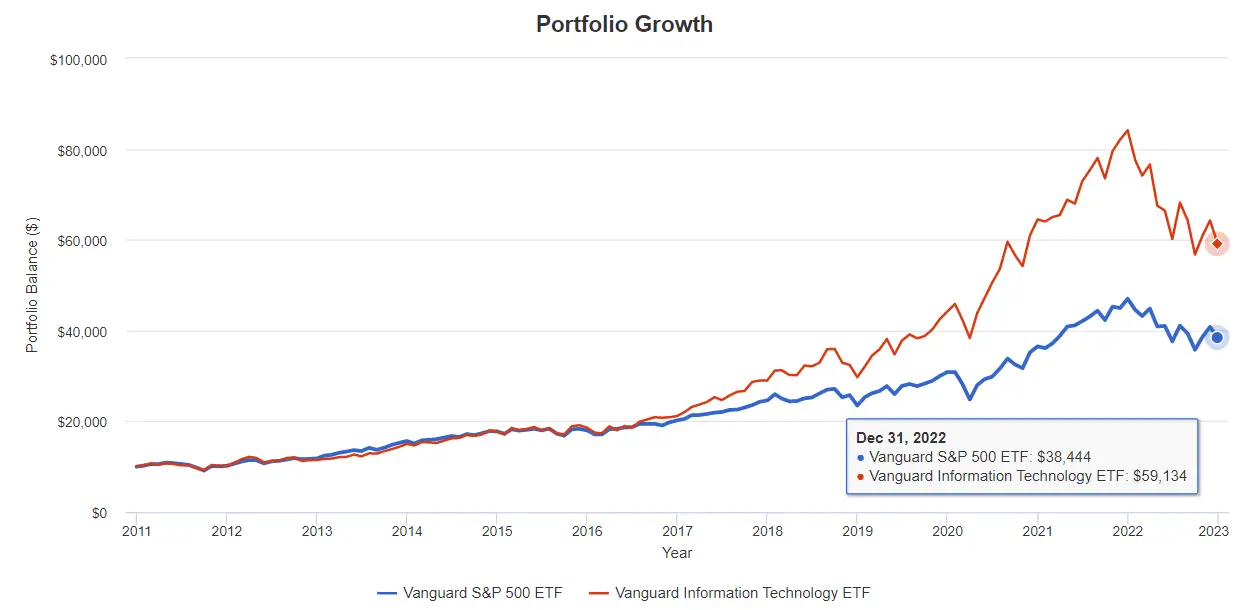
This is what you would have ended up with in Dec 2022, if you have invested $10,000 at the beginning of 2011.
VOO (Vanguard S&P 500 ETF): $38,444
VGT (Vanguard Information Technology ETF): $59,134
From the graph above, we can see that VGT outperform VOO’s by 50% more. This is an additional $20,690 in returns when compare with VOO.
Annual Returns
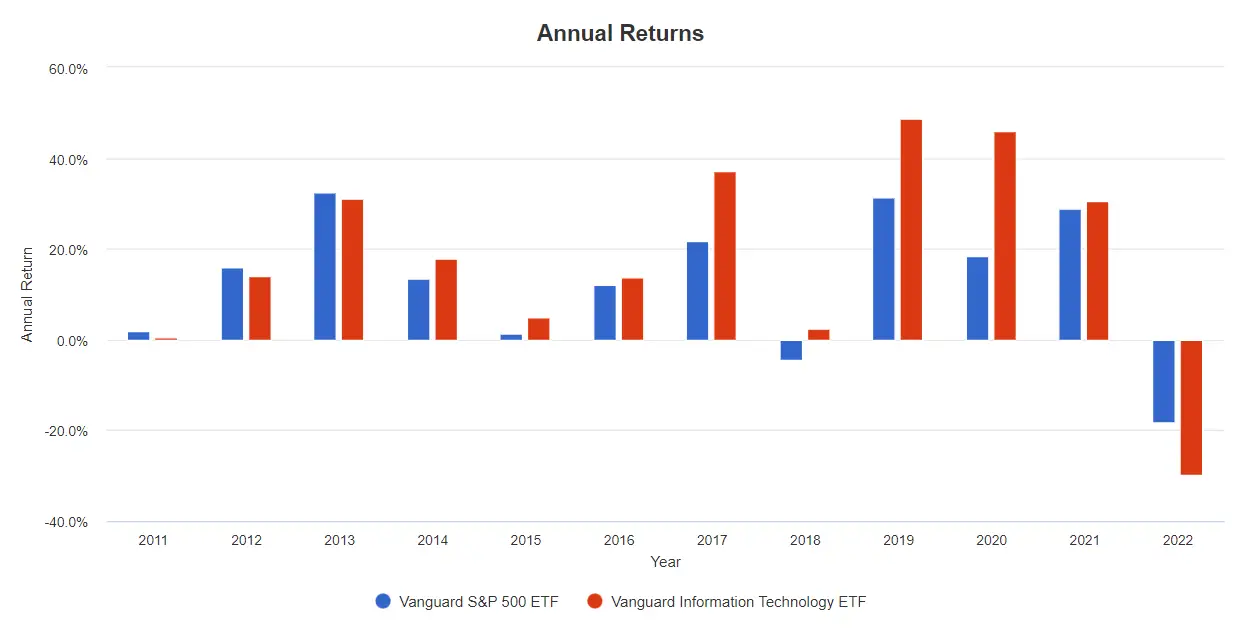
In 2018, VOO has a negative return of -4.5%. In 2022, VOO has a negative return of -18.19% vs VGT’s -29.70%.
Annualized Returns
| 1 Year | 3 Year | 5 Year | 10 Year | Since Inception | |
|---|---|---|---|---|---|
| VOO | -18.15% | 7.61% | 9.37% | 12.52% | 12.92% |
| VGT | -29.68% | 10.20% | 15.32% | 17.83% | 11.19% |
Source: advisors.vanguard.com
The 10 years annualized return for VGT vs VOO are 12.52% and 17.83% respectively. These are rather decent returns for funds that are passively managed.
Conclusion
Based on the past performance, VGT (Vanguard Information Technology ETF) is the one to pick with a portfolio growth of almost doubled more than VOO.
It also perform better in terms of the annual returns.
That said, I was rather surprised to find that companies like Amazon, Facebook and Google aren’t in the VGT list. But then, we can see that this didn’t prevent VGT from outperforming VOO.
However, if you want a more diversified portfolio, then stick with VOO. You can’t go wrong with a 10 year annualized return of 12.52% too.
As always, remember that Past Performance is No Guarantee of Future Results.