An Overview Of VGT vs QQQ
| VGT | QQQ | |
|---|---|---|
| Benchmark Index | MSCI US Investable Market IT 25/50 Index | Nasdaq-100 Index |
| Style | Passive | Passive |
| Inception Date | 26 Jan 2004 | 10 Mar 1999 |
| Expense Ratio | 0.10% | 0.20% |
| Number of Stocks | 360 | 102 |
| % of 10 largest holdings | 60.45% | 52.3% |
| Dividend Yield | 0.71% | 0.58% |
| AUM | $51.1 B | $179.892 B |
Source: advisors.vanguard.com and www.invesco.com
VGT has a expense ratio of 0.10% compared to QQQ’s 0.20%. This means that for every $10,000 you invest, you are only paying $10 and $20 respectively each year in management expenses.
VGT has a slightly higher dividend yield at 0.71% vs QQQ’s 0.58%. Personally, I wouldn’t buy these ETFs for the yield as these are pretty low yield rates. These ETFs are more suited for growth play rather than dividend play.
VGT (Information Technology ETF) is made up of companies that are in the technology software and service, technology hardware and equipment and semiconductor and semiconductor equipment manufacturers sectors. They include companies that are between small to large market capitalization
Invesco QQQ includes 100 of the largest domestic and international nonfinancial companies listed on the Nasdaq Stock Market based on market capitalization. This means that only top 100 largest market capitalization companies are included in the ETF.
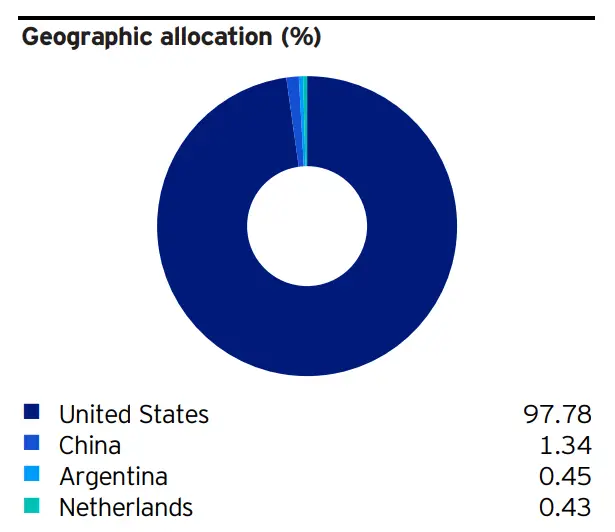
VGT is a pure US play, as it invests only in US companies. QQQ, on the other hand, has 2%~ of the total fund allocated to international companies.
Fund Composite VGT Vs QQQ
Top 10 Fund Holdings
| VGT | QQQ |
|---|---|
| Apple Inc. (AAPL) 22.98% | Apple Inc (AAPL) 12.72% |
| Microsoft Corp. (MSFT) 17.66% | Microsoft Corp (MSFT) 10.02% |
| NVIDIA Corp. (NVDA) 4.87% | Amazon.com Inc (AMZN) 7.17% |
| Visa Inc. (V) 2.84% | Tesla Inc (TSLA) 3.99% |
| Mastercard Inc. (MA) 2.71% | NVIDIA Corp (NVDA) 3.856% |
| Adobe Inc. (ADBE) 2.02% | Alphabet Inc (GOOG) 3.84% |
| Broadcom Inc. (AVGO) 1.91% | Alphabet Inc (GOOGL) 3.64% |
| Cisco Systems Inc./Delaware (CSCO) 1.87% | Meta Platforms Inc (FB) 3.386% |
| salesforce.com Inc. (CRM) 1.81% | Cisco Systems Inc/Delaware (CSCO) 1.86% |
| Accenture plc (ACN) 1.78% | Broadcom Inc (AVGO) 1.84% |
| 60.45% of total asset | 52.2% of total asset |
Source: advisors.vanguard.com and www.invesco.com
The top 10 holdings of both funds makes up more than half of the total asset.
With VGT, the top 2 holdings makes up 40.64% of the fund! Which means if AAPL or MSFT has a poor performance, then it will affect VGT greatly. This is a concentration risk to note when you are buying into VGT.
QQQ does slightly better in this aspect that top 3 holdings makes up almost 30% of the fund.
Another thing that I noticed with VGT is that companies such as Amazon, Facebook and Google are not included in the ETF. Amazon is classified as Internet & Direct Marketing Retail and Google and Facebook are under Interactive Media & Services. This means they do not fall under any the sub categories in VGT as seen below.

Overlapping Counters

There are a total of 39 overlapping counters between VGT and QQQ.
Performance Of VGT Vs QQQ
Portfolio Growth
Using the Portfolio Visualizer to back test these 2 ETFs, we can then compare the portfolio growth between Feb 2004 – Jan 2022. The time period was constrained by the available data for Vanguard Information Technology ETF (VGT).
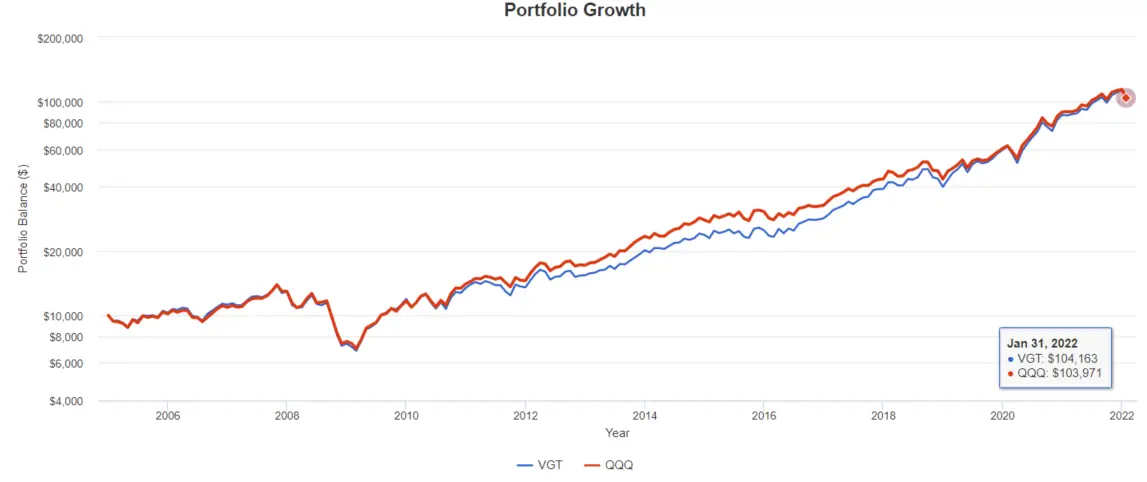
This is what you would have ended up with in Jan 2022, if you have invested $10,000 at the beginning of 2004.
VGT (Vanguard Information Technology ETF): $104,163
QQQ (Invesco QQQ): $103,971
These 2 ETFs have similar growth based on the chart above.
Annual Returns
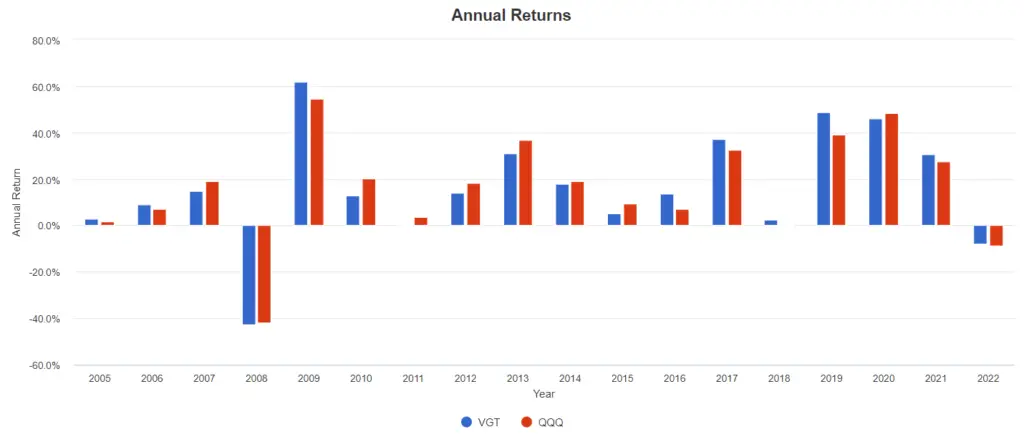
The worst negative return happened in 2008, with VGT losing -42.81% vs QQQ’s -41.73%.
Annualized Returns
| 1 Year | 3 Year | 5 Year | 10 Year | |
|---|---|---|---|---|
| VGT | 21.12% | 21.12% | 28.58% | 21.75% |
| QQQ | 16.10% | 30.17% | 24.83% | 20.82% |
Source: advisors.vanguard.com and www.invesco.com
The 10 years annualized return for both funds sits at ~20%. These are very good returns for funds that are passively managed.
Conclusion
Both funds perform rather similar. However, I’m leaning towards QQQ on this.
First of all, even though VGT consist of 360 companies, the top 2 holdings makes up ~40% of the total asset for VUG. This is a rather huge concentration risk.
Secondly, the fund omitted other major tech companies like Google and Amazon. Although, this didn’t impact much on the performance when compared to QQQ.
That said, both funds provided very high 10 years annualized returns. So you can’t go wrong with either ones.
As always, remember that Past Performance is No Guarantee of Future Results. And none of the content written should be taken as financial advice.