Technology is ingrain in most parts of our daily life now. We use our phones to catch up on news, buy our groceries online, and are able to work remotely thanks to the technologies available. It is no wonder that most investor would want to include tech stocks in their portfolio. In this article, we will be doing a comparison of these tech ETFs, VGT (Vanguard Information Technology ETF) vs XLK (The Technology Select Sector SPDR Fund).
The main difference between VGT vs XLK is, VGT includes tech companies that are of small and medium market caps on top of the large-cap and above companies. XLK, on the other hand, only includes tech companies that are in the S&P 500 index. This means that it does not include companies that are of small and medium caps.
Now let’s read on for a more comprehensive coverage.
An Overview Of VGT vs XLK
| VGT | XLK | |
|---|---|---|
| Benchmark Index | MSCI US Investable Market Information Technology 25/50 Index | Technology Select Sector Index |
| Style | Passive | Passive |
| Inception Date | 26 Jan 2004 | 22 Dec 1998 |
| Expense Ratio | 0.10% | 0.10% |
| Number of Stocks | 322 | 65 |
| Yield | 0.77% | 0.88% |
| % of 10 largest holdings | 61.5% | 71.37% |
| As of 6/30/2023 | As of 7/27/2023 |
Both these funds are passively managed with the focus on technology theme.
VGT tracks the MSCI US Investable Market Information Technology 25/50 Index, which captures the large, mid and small cap companies in the Information Technology sector in the US. XLK tracks the Technology Select Sector Index, which only include technology companies that are in the S&P 500 index.
This is also why we see the vast difference in the number of stocks held by each ETF.
The expense ratio is 0.10% for both VGT and XLK. This means that for every $10,000 invested, $10 of fees are paid each year for management expenses.
Top 10 Holdings
| VGT | XLK |
|---|---|
| APPLE INC 23.09% | APPLE INC 23.17% |
| MICROSOFT CORP 20.53% | MICROSOFT CORP 21.96% |
| NVIDIA CORP 4.25% | NVIDIA CORP 5.03% |
| BROADCOM INC 3.11% | BROADCOM INC 4.46% |
| ADOBE INC 1.94% | ADOBE INC 2.82% |
| CISCO SYSTEMS INC/DELAWARE 1.83% | SALESFORCE INC 2.64% |
| SALESFORCE INC 1.82% | CISCO SYSTEMS INC 2.60% |
| ACCENTURE PLC 1.68% | ACCENTURE PLC CL A 2.41% |
| ORACLE CORP 1.67% | ORACLE CORP 2.14% |
| ADVANCED MICRO DEVICES INC 1.58% | ADVANCED MICRO DEVICES INC 2.14% |
| 61.5% of total asset As of 6/30/2023 | 71.37% of total asset As of 7/27/2023 |
The top 10 holdings for these 2 ETFs are the same. And the top 10 on both funds makes up more than half of the total asset.
What is even more interesting is, all the 65 companies that are in XLK can be found in VGT. And these 65 companies makes up 82.84% of the total asset of VGT.

This means that when you buy VGT, you are also buying XLK in the process.
Performance of VGT vs XLK
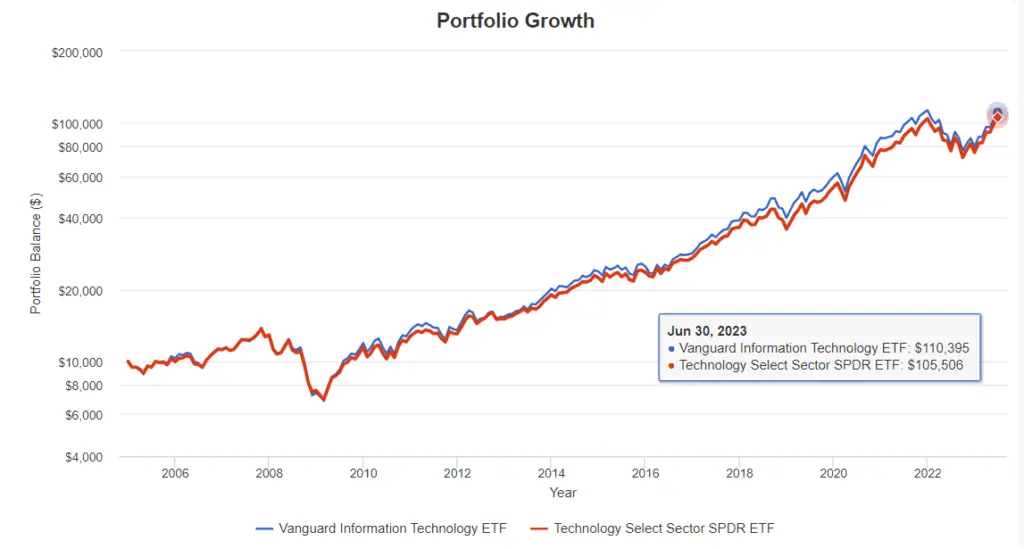
Using the Portfolio Visualizer to back test these 2 ETFs, we can then compare the portfolio growth between Feb 2004 – Feb 2021. The time period was constrained by the available data for Vanguard Information Technology ETF (VGT)

This is what you would have ended up with in Jun 2022, if you have invested $10,000 at the beginning of 2004.
VGT (Vanguard Information Technology ETF): $110,395
XLK (The Technology Select Sector SPDR Fund): $105,506
From the graph above, we can see that VGT outperformed XLK by an additional $4,889 (4.63%) in returns.
Annual Returns

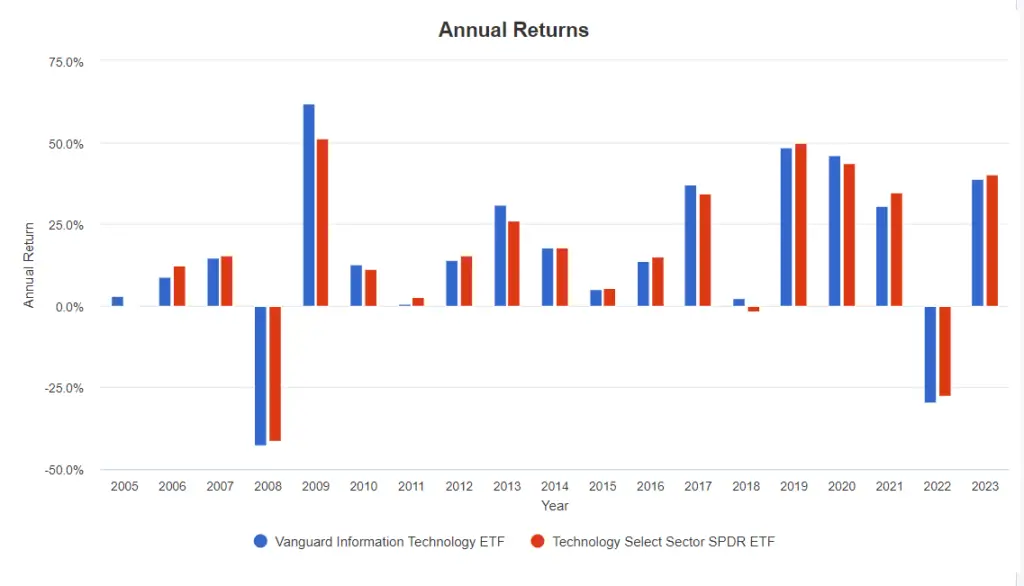
In the past 15 years, there is only 2 years where VUG has negative returns, compared to XLK, which has negative returns in 2005, 2008, 2018, 2022.
Both funds performed rather similar during the market downturn in 2008. VGT had losses of -42.82% vs XLK’s -41.51%. And in 2022, VGT had losses of -29.7% vs XLK’s -27.73%.
Annualized Returns
| 1 Year | 3 Year | 5 Year | 10 Year | Since Inception | |
|---|---|---|---|---|---|
| VGT | 36.66% | 17.57% | 20.86% | 20.95% | 12.78% |
| XLK | 38.16% | 19.51% | 21.46% | 20.68% | 8.63% |
Source: advisors.vanguard.com and www.ssga.com
The 10 years annualized return for VGT and XLK are 20.95% and 20.68% respectively. These are rather decent returns for funds that are passively managed.
Conclusion
Based on the past performance, VGT (Vanguard Information Technology ETF) is the one to pick with a portfolio growth of 4.63% more than XLK.
It also perform better in terms of the annual returns. In the last 17 years, 2008 and 2022 are the only years where it had negative returns. On top of that, both funds perform similar during the 2008 and 2022 downturn, similar losses but better returns for VGT.
I also like that when you VGT, you are also also buying XLK. Because all the companies that are in XLK are also in VGT. And further more, VGT is a little more diversified with the fact that it had 379 companies in the fund compared to the 76 in XLK.
VGT just ticks all the boxes:
- Higher returns
- Similar performance during downturn
- lower expense ratio
- more diversified
As always, remember that Past Performance is No Guarantee of Future Results.