Before deciding which index ETF to invest in, you can find out more on what an ETF is, or what an Index is, and why invest in ETFs here.
An Overview of SPY vs SPYG vs SPYV
| SPDR S&P 500 ETF (SPY) | SPDR Portfolio S&P 500 Growth ETF (SPYG) | SPDR Portfolio S&P 500 Value ETF (SPYV) | |
| Benchmark index | S&P 500 Index | S&P 500 Growth Index | S&P 500 Value Index |
| Expense Ratio | 0.0945% | 0.04% | 0.04% |
| Number of Stocks | 504 | 240 | 446 |
| % of 10 largest holdings | 27.66% | 53.01% | 18.36% |
| Dividend Yield | 1.52% | 0.85% | 2.24% |
| Assets Under Management | $357,600.14 M | $13,031.32 M | $12,751.24 M |
SPY vs SPYG vs SPYV- Main Difference
SPY tracks the S&P 500 index.
SPYG Growth ETF tracks companies in S&P500 index that exhibit the strongest growth characteristics based on: sales growth, earnings change to price ratio, and momentum.
SPYV Value ETF tracks companies in S&P 500 index that with the strongest value characteristics based on: book value to price ratio, earnings to price ratio, and sales to price ratio.
Sectors
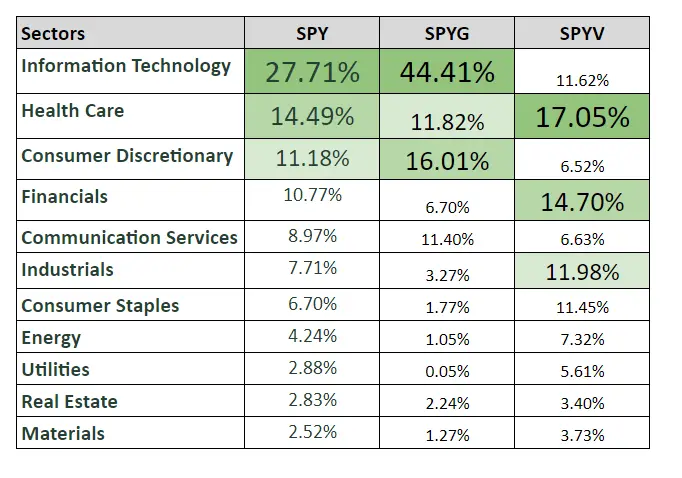
From the above, we can see that SPYG Growth ETF is skewed heavily towards Information Technology companies with 44.41% As a growth ETF, it makes sense as tech companies tend to be high growth.
For SPY, Information Technology companies also takes up the top sector but at 27.71%
However for SPYV Value ETF, Health Care takes the top spot with 17.05%. You can also see that it has a nice even mix of the different sectors, compared to SPYG.
Let’s look at the top 10 holdings of each of these ETFs to get an idea of the type of companies that it invests in.
| SPY | SPYG | SPYV |
|---|---|---|
| Apple Inc. (AAPL) 7.05% | Apple Inc. (AAPL) 14.36% | Berkshire Hathaway Inc. Class B (BRK.B) 3.040% |
| Microsoft Corporation (MSFT) 5.88% | Microsoft Corporation (MSFT) 11.97% | Johnson & Johnson (JNJ) 2.64% |
| Amazon.com Inc. (AMZN) 3.22% | Amazon.com Inc. (AMZN) 6.56% | Exxon Mobil Corporation (XOM) 2.21% |
| Alphabet Inc. Class A (GOOGL) 2.05% | Alphabet Inc. Class A (GOOGL) 4.18% | Procter & Gamble Company (PG) 1.99% |
| Alphabet Inc. Class C (GOOG) 1.90% | Alphabet Inc. Class C (GOOG) 3.86% | Chevron Corporation (CVX) 1.70% |
| Tesla Inc (TSLA) 1.87% | Tesla Inc (TSLA) 3.80% | UnitedHealth Group Incorporated (UNH) 1.66% |
| Berkshire Hathaway Inc. Class B (BRK.B) 1.55% | NVIDIA Corporation (NVDA) 2.72% | Coca-Cola Company (KO) 1.41% |
| UnitedHealth Group Incorporated (UNH) 1.46% | Meta Platforms Inc. Class A (META) 2.56% | Merck & Co. Inc. (MRK) 1.33% |
| Johnson & Johnson (JNJ) 1.35% | Eli Lilly and Company (LLY) 1.55% | Verizon Communications Inc. (VZ) 1.21% |
| NVIDIA Corporation (NVDA) 1.34% | Home Depot Inc. (HD) 1.45% | Visa Inc. Class A (V) 1.17% |
| 27.66% of total net asset | 53.01% of total net asset | 18.36% of total net asset |
It’s no surprise that tech companies made up the majority or all (if you consider Tesla a Tech company) of the top 10 holdings for SPYG Growth ETF. Whereas for SPYV Value ETF, the top 10 consist of the more traditional companies, like Coca-Cola, J&J, PG and the banks and the telecommunications companies.
Interestingly, the top 10 of growth and value fund does not have any overlapping companies.
Are there any overlapping counters between these etfs?
We know that both SPYG and SPYV derives the companies from S&P 500 index, so there are definitely overlapping counters between SPY and and both SPYG and SPYV.
However, you be surprised to learn that, there are also 184 overlapping counters between SPYG and SPYV. So this means that there are value companies in SPYG and there are also growth companies in SPYV.
These are the companies that are falls under both growth and value categories.

SPY vs SPYG vs SPYV – Performance
Using the portfolio visualizer, I ran a back test on these 3 ETFs starting from inception date with an initial investment of $10,000. And this is what you will end up with in Dec 2020 if you have invested $10,000 at the start of 2001
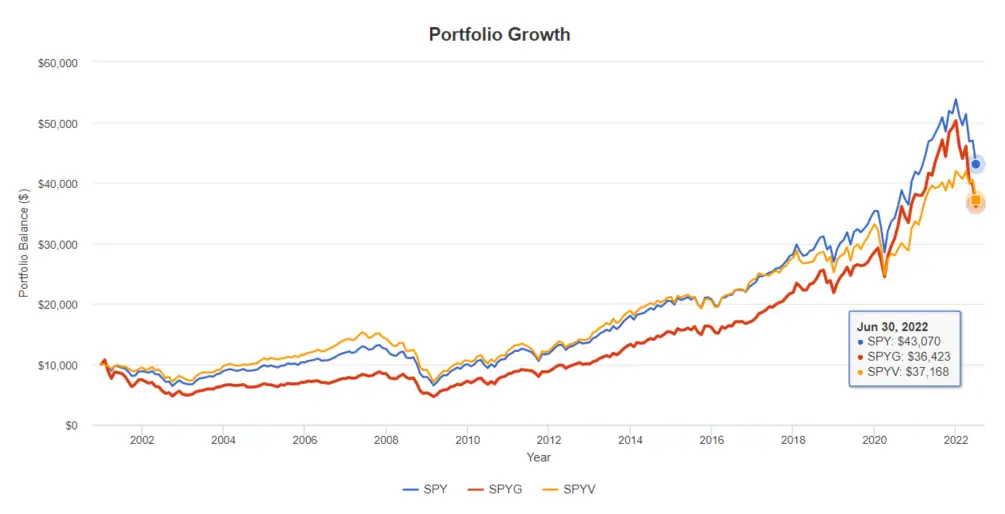
Below table shows the summary returns for each fund if you invested in 2001.
| SPY | SPYG | SPYV | |
|---|---|---|---|
| Final value | $43,070 | $36,423 | $7,168 |
| Annual Return (2001-2022) | 7.03% | 6.20% | 6.30% |
This is a very interesting 20 years chart. If you invested in Growth fund back in 2001, you would be in the red until 2013. And back then, Value fund was outperforming the Growth fund for most of periods.
Now if we ran the backtest from 2010, the result is very different.
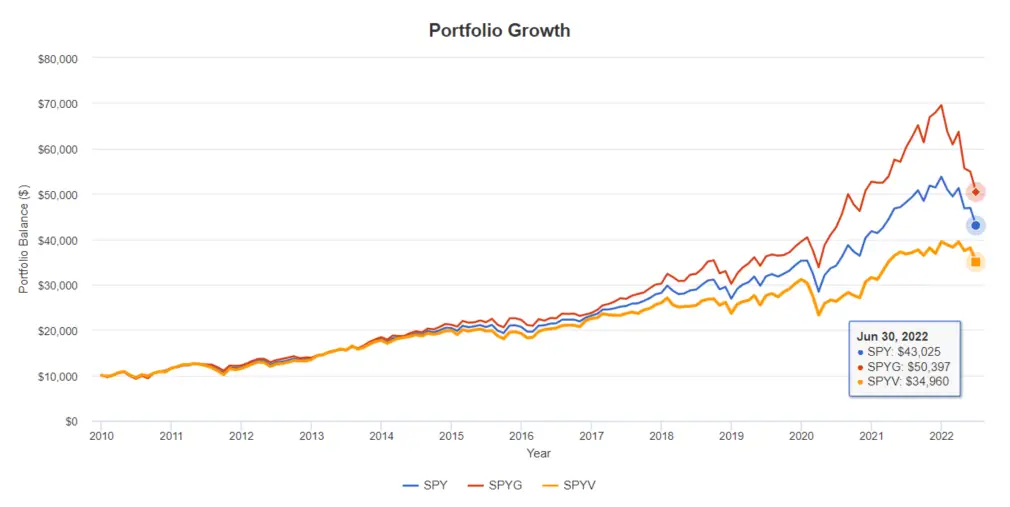
Below table shows the summary returns for each fund if you invested in 2010.
| SPY | SPYG | SPYV | |
|---|---|---|---|
| Final Value | $43,025 | $50,397 | $34,960 |
| Annual Return (2010-2022) | 12.38% | 13.81% | 10.53% |
From the chart above, we can see quite clearly that Growth fund is the leader in here.
SPY vs SPYG vs SPYV – Which is better?
We have seen that historically, value funds delivered higher returns. It is only in the recent years that growth stocks dominated. From these charts, we can conclude that Growth fund is not always the better performing funds. It depends on when you started investing. It is difficult to predict which one is the winner here.
Personally, I would go with SPYG, because it also contains value companies, and it includes all the big tech companies too.
You can also stick with SPY, which has a nice blend of Growth and Value companies in it. A 7.03% annual return is still better than a lot of actively managed funds out there with a higher expense ratio.
As always Past Performance is No Guarantee of Future Results.