An Overview of ARKX vs UFO
| ARKX | UFO | |
|---|---|---|
| Fund Objective | Investment theme of Space Exploration and innovation | Tracks SPACE Index |
| Fund Type | Active | Passive |
| Inception Date | 20 Mar 2021 | 07 May 2018 |
| Expense Ratio | 0.75% | 0.75% |
| Number of Stocks | between 40-55 | 31 |
| % of 10 largest holdings | 53.58% | 49.20% |
| AUM | $63.34 M | $131.96 M |
Source: ark-funds.com and procureetfs.com
ARKX defines “Space Exploration” as leading, enabling, or benefitting from technologically enabled products and/or services that occur beyond the surface of the Earth.
ARKX invests in these 4 types of companies
- Orbital Aerospace Companies
- Suborbital Aerospace Companies
- Enabling Technologies Companies
- Aerospace Beneficiary Companies
The companies selected are based on ARK’s Advisor, using its own internal research and analysis. Many of the companies may only have an indirect and not a substantial involvement in the space industry. They also may not derive any revenue from the space industry.
UFO, on the other hand tracks the SPACE index. SPACE index selects companies that meet one or more criteria for space-related business activities such as manufacturing space vehicle components and operating satellites.
The companies in the index must derive substantial (>50%) revenue from space-related activities.
This is why we see a stark difference in the company holding between the 2 funds.
Holdings Composite – ARKX VS UFO
Top 10 Holdings
| ARKX | UFO |
|---|---|
| TRIMBLE INC (TRMB) 9.47% | VIRGIN GALACTIC HOLDINGS INC COM (SPCE) 5.89% |
| THE 3D PRINTING ETF (PRNT) 6.9% | MAXAR TECHNOLOGIES INC (MAXR) 5.18% |
| KRATOS DEFENSE & SECURITY (KTOS) 6.47% | GLOBALSTAR INC (GSAT) 5% |
| IRIDIUM COMMUNICATIONS INC (IRDM) 5.86% | DISH NETWORK CORPORATION (DISH) 4.93% |
| L3HARRIS TECHNOLOGIES INC (LHX) 5.24% | MDA LTD (MDA CN) 4.89% |
| JD LOGISTICS INC (2618) 4.61% | TRIMBLE INC (TRMB) 4.87% |
| LOCKHEED MARTIN CORP (LMT) 4.22% | GARMIN LTD (GRMN) 4.78% |
| THALES SA (HO) 3.96% | IRIDIUM COMMUNICATIONS INC (IRDM) 4.63% |
| KOMATSU LTD (6301) 3.59% | SIRIUS XM HOLDINGS INC (SIRI) 4.6% |
| AMAZON.COM INC (AMZN) 3.26% | SES SA (SESG FP) 4.43% |
| 53.58% of total asset | 49.20% of total asset |
Source: ark-funds.com and procureetfs.com
From the above table, the top 10 makes up roughly half of the total asset for both ETFs. This might seem like a rather extreme % for just the top 10 holdings. But it is important to remember that these ETFs are narrowly focused on space and innovation industry.
Just looking at the top 10 holdings, some of ARKX’s holdings had me scratching my head. JD Logistics, Amazon? Amazon could be because of Jeff Bezos’s Blue Origin, but JD Logistics, maybe the analysts in ARK knows something we don’t.
There are only 2 companies (TRIMBLE INC and IRIDIUM COMMUNICATIONS INC) in the top 10 holdings that overlapps.
Overlapping Counters
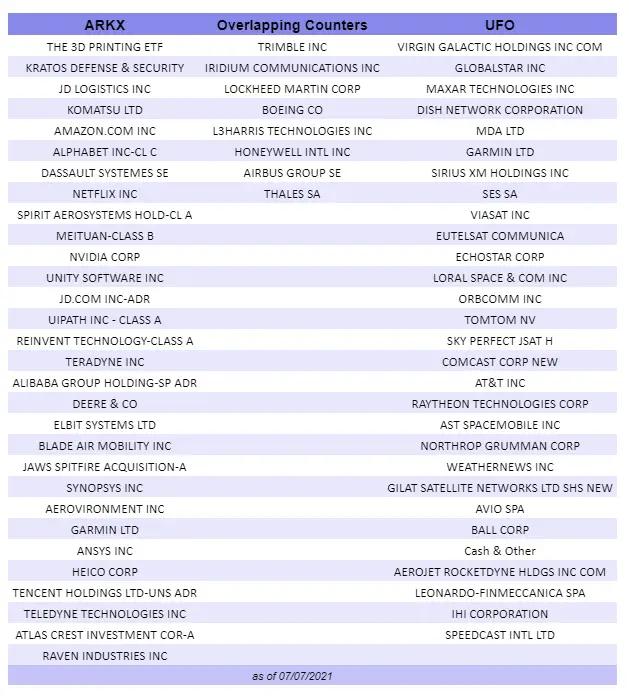
When we dive further into the full list of holdings, there are only 5 overlapping counters between these 2 ETFs. So we can see that these 2 ETFs are more different than the same.
Breakdown
| ARKX Tech Breakdown | |
|---|---|
| Aerospace Beneficiaries | 40.3% |
| Orbital Aerospace | 28.7% |
| Enabling Technology | 25.2% |
| Suborbital Aerospace | 5.8% |
When we look at technology breakdown for ARKX, Aerospace Beneficiaries companies made up 40.3% of the total fund.
From the prospectus, the definition of Aerospace Beneficiaries companies are companies whose operations stand to benefit from aerospace activities, including agriculture, internet access, global positioning system (GPS), construction, imaging, drones, air taxis and electric aviation vehicles. For example, agriculture companies utilize technologies advanced by space exploration and innovation, such as satellite imagery.
So this could be the reason why so many of the companies on ARKX doesn’t make much sense when you relate it to the space industry. But if you look at the perspective mentioned above, then maybe it make sense.
UFO doesn’t have a similar breakdown, but from the SPACE Index presentation, space related activities include:
- Telecommunications
- Television and Radio Broadcasting
- Rocket and Satellite Manufacturing and Operation
- Ground Equipment Manufacturing
- Space-Based Imagery and Intelligence Services
SPACE index divides it’s holdings into 2 tranches. 80% weightage is given to Pure-play (companies that derive majority of their revenues from space), and 20% would be for the rest.
Sector Breakdown
| ARKX | UFO | |
|---|---|---|
| Industrials | 47.1% | 32.47% |
| Information Technology | 22.2% | 17.96% |
| Consumer Discretionary | 13.4% | 5.18% |
| Communication Services | 9.6% | 43.65% |
| Materials | N.A. | 0.73% |
| Not Classified | 7.6% | N.A. |
There is also a huge difference in the sectors that both funds invest in. From the table above, we can see that Industrials and Information Technology makes up approx. 69% of ARKX. Whereas for UFO, Industrials and Communication Services makes up almost 75% of UFO.
Conclusion – ARKX VS UFO
Quite honestly, when you take an in depth look at the holdings of each fund, they are so different. Even though both funds claims to be in the Space industry, but they each have different definition of the types of companies that can be included.
ARKX seems to be more diversified, because of how they define Aerospace Beneficiaries companies. They included tech giants such as Amazon, Google and Netflix in ARKX. I’m really surprised that Virgin Galactic is not in the list.
UFO on the other hand, seems to fit the space industry more. Companies that are include are more related to space. At least Virgin Galactic is their top holding. After all, Richard Branson is going to the edge of space on July 11 2021!
As always, these are all my personal opinion and should not be taken as an investment advice.