In my current income portfolio, I hold investments in Singapore banks, Real Estate Investment Trusts (REITs), and Singapore Savings Bonds, all of which have provided a stable income.
Now, I’m considering expanding my portfolio to include dividend-paying stocks from the U.S. market. One way to do this could be through dividend-focused ETFs. In this regard, the Vanguard Dividend Appreciation ETF (VIG) has caught my attention as a potential addition to diversify and strengthen my portfolio.
In this review, I’ll delve into the fundamentals of VIG.
Understanding the Index
VIG tracks the S&P U.S. Dividend Growers Index.. Here’s what you should know about this index.
- What’s Included:
- Stocks must be part of the S&P United States Broad Market Index (BMI) and have a primary listing on major U.S. exchanges like the NYSE, NASDAQ, or Cboe.
- Companies in the real estate investment trust industry are excluded. Stocks need a certain level of trading activity (median daily value traded of at least US$ 1 million, or US$ 500,000 for current constituents). Companies must have a history of increasing dividends every year for at least 10 years.
- How Stocks Are Chosen:
- Companies must show a consistent increase in dividends annually for the past 10 years. This is measured using the dividend history of the primary share class.
- Ranking Stocks:
- Eligible companies are ranked based on their indicated annual dividend yield (IAD). This is the percentage of the stock price that is paid out as dividends.
- Picking Stocks for the Index:
- Every year, the index goes through an update process. During this update, they make a list of all the companies that could be in the index and sort them based on how much of their stock price they pay out as dividends (this is called the indicated annual dividend yield or IAD). If a company has different types of stocks available, they only look at the main type for this sorting.
- Once they have this sorted list, they remove the top 25% of companies that pay the highest dividends (for companies already in the index, they only remove the top 15%). This might seem odd, but it’s to make sure the index doesn’t just have companies that pay really high dividends, which can sometimes be risky.
- After removing these companies, they take the rest and use them to create the index for that year. This way, the index ends up with a mix of companies that are seen as more stable and reliable when it comes to paying dividends.
- Keeping the Index Balanced:
- Annual Reconstitution: The index is updated every March, with a three-day rebalancing process. This ensures the index reflects the latest stock performances and eligibility criteria.
- Quarterly Updates: Adjustments are made four times a year to account for changes in shares and investable weight factors (IWFs).
- Weighting Stocks:
- Stocks are weighted based on their free-float market capitalization, with a cap to ensure no single stock makes up more than 4% of the total index weight.
[source: https://www.spglobal.com/spdji/en/indices/dividends-factors/sp-us-dividend-growers-index/#overview]
Fundamentals of VIG ETF
Asset Allocation
VIG exclusively focuses on the U.S. equity market, encompassing a total of 314 stocks.
Top 10 Holdings
| Holdings | % of fund |
|---|---|
| Microsoft Corp. | 4.87 % |
| Apple Inc. | 4.34 % |
| Exxon Mobil Corp. | 3.40 % |
| UnitedHealth Group Inc. | 3.37 % |
| JPMorgan Chase & Co. | 3.04 % |
| Johnson & Johnson | 2.71 % |
| Visa Inc. Class A | 2.56 % |
| Procter & Gamble Co. | 2.49 % |
| Broadcom Inc. | 2.40 % |
| Mastercard Inc. Class A | 2.39 % |
| Total | 31.57% |
as of 30 Sep 2023
The top 10 holdings appears to be diversified across different sectors. It includes technology companies (Microsoft, Apple), energy (Exxon Mobil), healthcare (UnitedHealth, Johnson & Johnson), financial services (JPMorgan Chase, Visa, Mastercard), consumer goods (Procter & Gamble), and technology/semiconductor (Broadcom). This diversification can help mitigate risks as it’s not overly reliant on one sector.
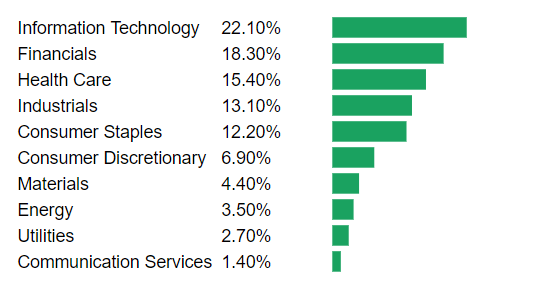
Sector allocation

as of 30 Sep 2023
From the chart above, we can see that VIG appears to be strategically positioned with a strong emphasis on technology, and significant investments in financials and healthcare.
At the same time, it maintains a diversified approach by including various other sectors, though with lesser emphasis on materials, energy, utilities, and communication services.
Performance
Historical performance

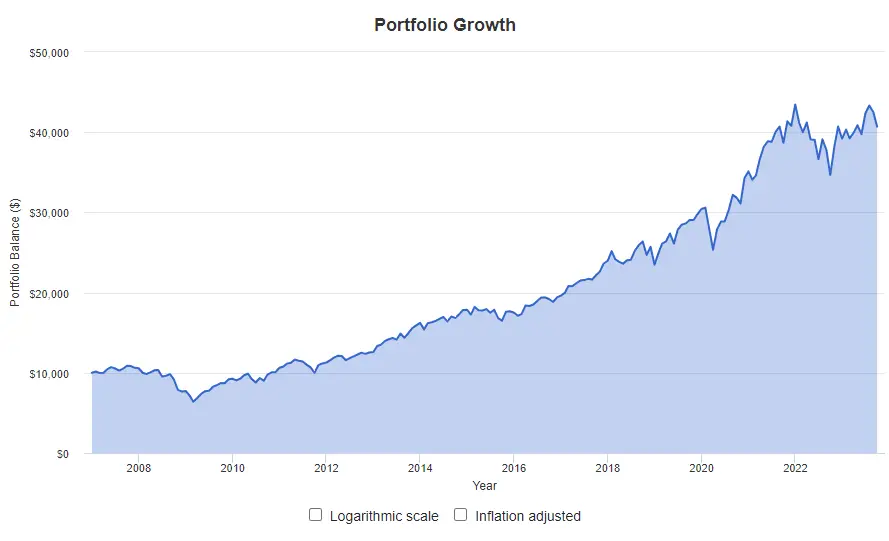
If you had invested $10,000 in VIG since 2007, your portfolio would have grown to $40,696 at the end of Sep 2023.

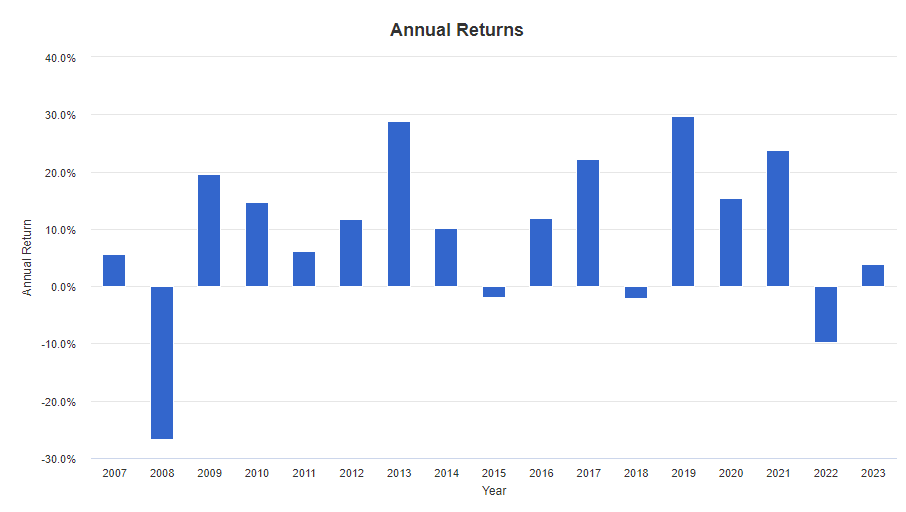
The graph above illustrates the annual returns of VIG. The fund has navigated through diverse market conditions over the years. Its most challenging year was 2008, during which it experienced a return of -26.69%
Dividend Yield
The VIGETF has a dividend yield of 2.11%(TTM) as of 30 Sep 2023. Dividends are payout every quarter.
Dividend Growth

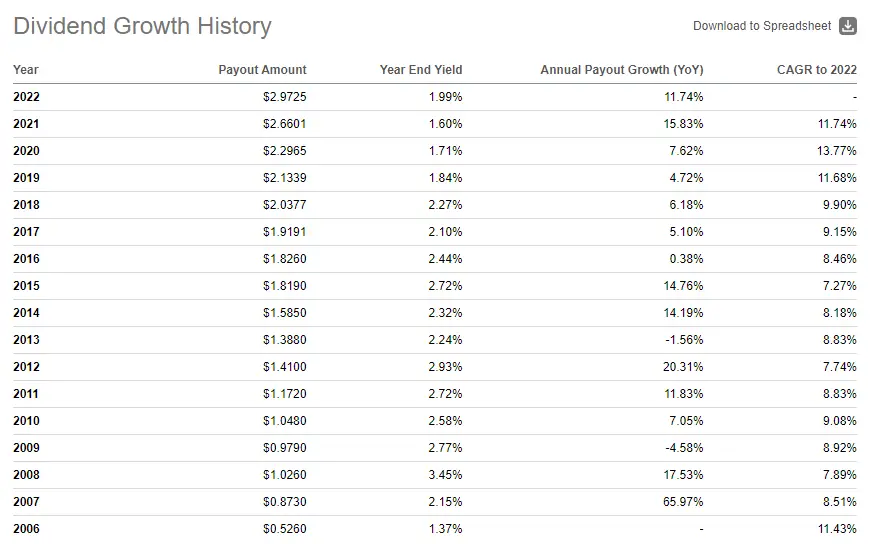
Based on table above, UDVD demonstrates a general trend of increasing dividend distributions. Key points include:
- Overall Upward Trend in Payout Amounts: There is a clear upward trend in payout amounts from 2006 to 2022. Starting at $0.5260 in 2006, the payout amount has consistently increased, reaching $2.9725 in 2022.
- Fluctuating Annual Payout Growth: The annual payout growth rates are quite variable, with some years experiencing substantial increases and others showing decreases or minimal growth. For instance, 2007 saw an impressive growth of 65.97%, while 2009 experienced a decline of 4.58%.
Expense Ratio
The total expense ratio stands at 0.06%, which is deemed to be on the lower end for an exchange-traded fund (ETF).
If you invest $100,000 with a 0.06% expense ratio, your annual fee would be $60.
Now, let’s say your investment grows to $200,000. With the same 0.06% expense ratio, your annual fee would then be around $120.
So, as your investment grows over the years, the amount you pay in fees also increases because it’s a percentage of your total investment. This is an important factor to consider, as while the percentage stays the same, the actual dollar amount you’re paying will go up as your portfolio increases in value.
Who Should Consider Investing in VIG?
Risk Tolerance: Ideal for investors with a moderate risk tolerance. VIG’s focus on companies with a consistent history of dividend growth often leads to a portfolio of financially stable and resilient companies, reducing the overall risk compared to more aggressive investments.
Investment Horizon: Best suited for long-term investors. Given its history of steady growth and the nature of dividend investing, VIG is well-aligned with those who have a long-term investment horizon and can weather short-term market fluctuations.
Income Requirements: Appealing for investors seeking regular income. The fund’s focus on dividend growth makes it a viable option for those requiring a steady income stream, such as retirees or income-focused investors.
Diversification Needs: Ideal for investors seeking sector diversification. With holdings across different sectors like technology, healthcare, and financial services, VIG offers a balanced exposure, mitigating risks associated with over-concentration in one sector.
Expense Sensitivity: Favorable for cost-conscious investors. With a low expense ratio of 0.06%, VIG is an affordable choice for investors mindful of minimizing fees to maximize returns.
Dividend Growth Focus: Suitable for investors prioritizing dividend growth. VIG targets companies that have increased dividends consistently for at least 10 years, catering to those focused on dividend growth as a key investment criterion.
Market Understanding: Appropriate for investors with a basic understanding of the market. While VIG’s diversified approach reduces the need for intensive market knowledge, a fundamental understanding of stock market dynamics can help investors make more informed decisions.
Tax Considerations: Beneficial for investors considering tax implications. As VIG provides dividend income, it’s important for investors to consider the tax treatment of dividends in their investment strategy, particularly those in higher tax brackets.
Conclusion
The Vanguard Dividend Appreciation ETF (VIG) presents a viable option for investors aiming to diversify their income-driven portfolios, especially those interested in the U.S. market. Tracking the S&P U.S. Dividend Growers Index, VIG focuses on stocks with a history of increasing dividends over a decade, ensuring stability and consistent income.
VIG’s diverse holdings span sectors like technology, healthcare, and finance, offering a balanced risk profile. From 2007 to 2023, a $10,000 investment in VIG grew to $40,696, highlighting its growth potential and resilience during market fluctuations. The fund’s increasing dividend payouts and low expense ratio of 0.06% further enhance its appeal.
Moreover, with the current price of VIG nearing 52-week low ($150.16 as of 29 Oct 2023), it presents an even more compelling opportunity to consider investing.
In conclusion, for investors with moderate risk tolerance, a long-term horizon, and a need for regular income, VIG appears to be a prudent choice.
However, as a non-U.S. resident, you should be aware of the additional tax implications.
E.g. for me as a Singaporean investor, the dividend withholding tax rate of 30% and the U.S. government’s estate tax, which ranges from 18 to 40% for assets worth more than US$60,000, could significantly impact the net returns from my investment in SCHD.
These tax considerations are crucial and might influence the overall attractiveness of investing in U.S.-based assets like SCHD.
As always, it’s prudent to consider your personal financial situation, risk tolerance, and investment objectives before making any investment decisions.