An Overview of ONEQ vs QQQ
| ONEQ (Fidelity NASDAQ Composite Index ETF) | QQQ (Invesco QQQ ETF) | |
|---|---|---|
| Benchmark Index | NASDAQ Composite Index | Nasdaq-100 Index |
| Expense Ratio | 0.21% | 0.20% |
| Number of Stocks | 1017 | 102 |
| % of 10 largest holdings | 44.11% | 50.74% |
| Dividend Yield | 0.75% | 0.53% |
Source: institutional.fidelity.com and www.invesco.com
ONEQ ETF aims to provide returns that closely matches the price and performance of the NASDAQ Composite Index. It normally invest at least 80% of the stocks that are in the index.
QQQ, on the other hand, tracks the Nasdaq-100 Index. This index includes 100 of the largest US and international non financial companies that are listed on Nasdaq based on Market Cap.
Because of this, we can see that ONEQ ETF holds 1017 number of stocks as compared to QQQ’s 102.
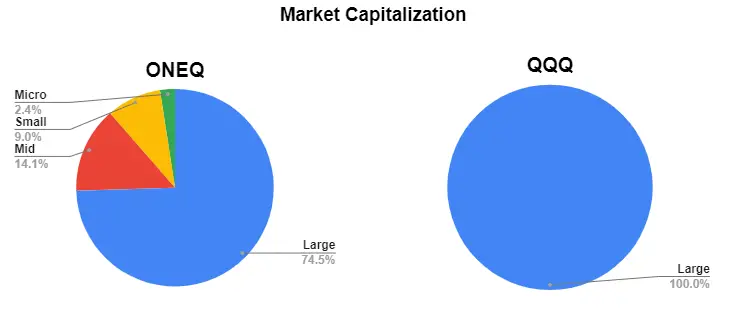
Another difference is that ONEQ invest approx. 25% in Mid, Small and Micro cap. companies, whereas QQQ invests 100% in large cap. companies.

Top 10 Holdings
| ONEQ (Fidelity NASDAQ Composite Index ETF) | QQQ (Invesco QQQ ETF) |
|---|---|
| Apple Inc (10.75%) | Apple Inc (12.39%) |
| Microsoft Corp (8.53%) | Microsoft Corp (8.95%) |
| Amazon.com Inc (8.36%) | Amazon.com Inc (8.66%) |
| Alphabet Inc C (3.11%) | Tesla Inc (5.20%) |
| Facebook Inc (3.50%) | Facebook Inc (3.46%) |
| Tesla Inc (2.81%) | Alphabet Inc C (3.29%) |
| Alphabet Inc A (2.79%) | Alphabet Inc A (2.98%) |
| NVIDIA Corp (1.71%) | NVIDIA Corp (2.71%) |
| PayPal Holdings Inc (1.31%) | PayPal Holdings Inc (2.35%) |
| Comcast Corp (1.25%) | Netflix Inc (1.99%) |
| As of 30/11/2020 | As of 22/01/2021 |
ONEQ vs QQQ – Performance
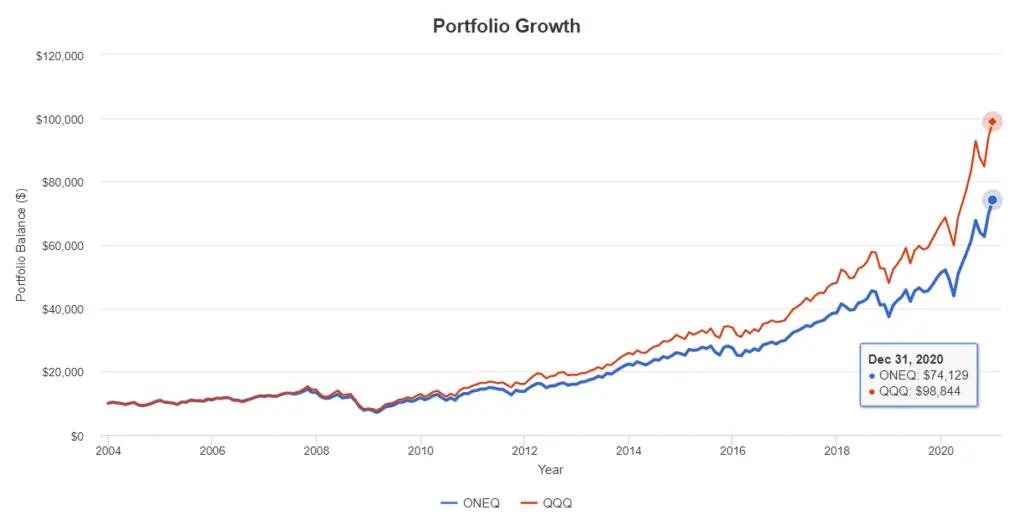
Using the Portfolio Visualizer to back test these 2 ETFs, we can then compare the portfolio growth between Oct 2003 – Dec 2020. The time period was constrained by the available data for ONEQ (Fidelity NASDAQ Composite Index ETF).

This is what you will end up with at the end of Dec 2020 if you have invest $10,000 in 2015.
ONEQ (Fidelity NASDAQ Composite Index ETF): $74,129
QQQ (Invesco QQQ): $98,844
This works out to be 33% more in returns if you had invested in QQQ compared to ONEQ.
Annual Returns

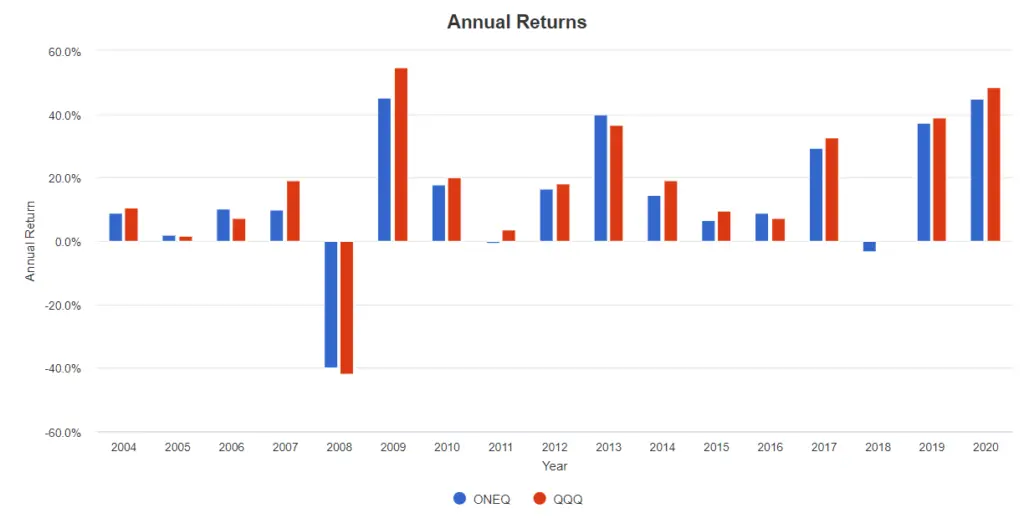
In these 15 years period, ONEQ had 3 years of losses in 2008, 2011 and 2018, whereas QQQ only had losses in 2008 and 2018.
In 2008, ONEQ delivers -39.80% in losses vs QQQ’s -41.73%. From this, we can see that during a downturn, one must be able to stomach the huge losses that might happen when there is a massive market downturn.
Annualized Returns
| 1 Year | 3 Year | 5 Year | 10 Year | |
|---|---|---|---|---|
| ONEQ | 44.89% | 24.38% | 22.04% | 18.51% |
| QQQ | 48.40% | 27.24% | 23.96% | 20.35% |
Both these ETFs delivers exceptionally high annualized returns for a passively managed ETF, with the QQQ performing slightly better.
Conclusion – Which NASDAQ Index ETF should you choose?
Based on past performance, QQQ performs slightly better. Which means having mid, small and micro caps in your portfolio doesn’t increase the performance. You might be better off investing in large cap. companies in this case.
However, if you do want to include mid to micro companies in your portfolio, then ONEQ ETF might be a better choice.
Ultimately, both ETFs performed really well for the last 10 year, so you can’t go wrong with choosing either of them.
As always, Past Performance is No Guarantee of Future Results.